Immigrants from Eastern Africa vs Eastern European Single Female Poverty
COMPARE
Immigrants from Eastern Africa
Eastern European
Single Female Poverty
Single Female Poverty Comparison
Immigrants from Eastern Africa
Eastern Europeans
21.6%
SINGLE FEMALE POVERTY
15.1/ 100
METRIC RATING
209th/ 347
METRIC RANK
19.1%
SINGLE FEMALE POVERTY
99.7/ 100
METRIC RATING
57th/ 347
METRIC RANK
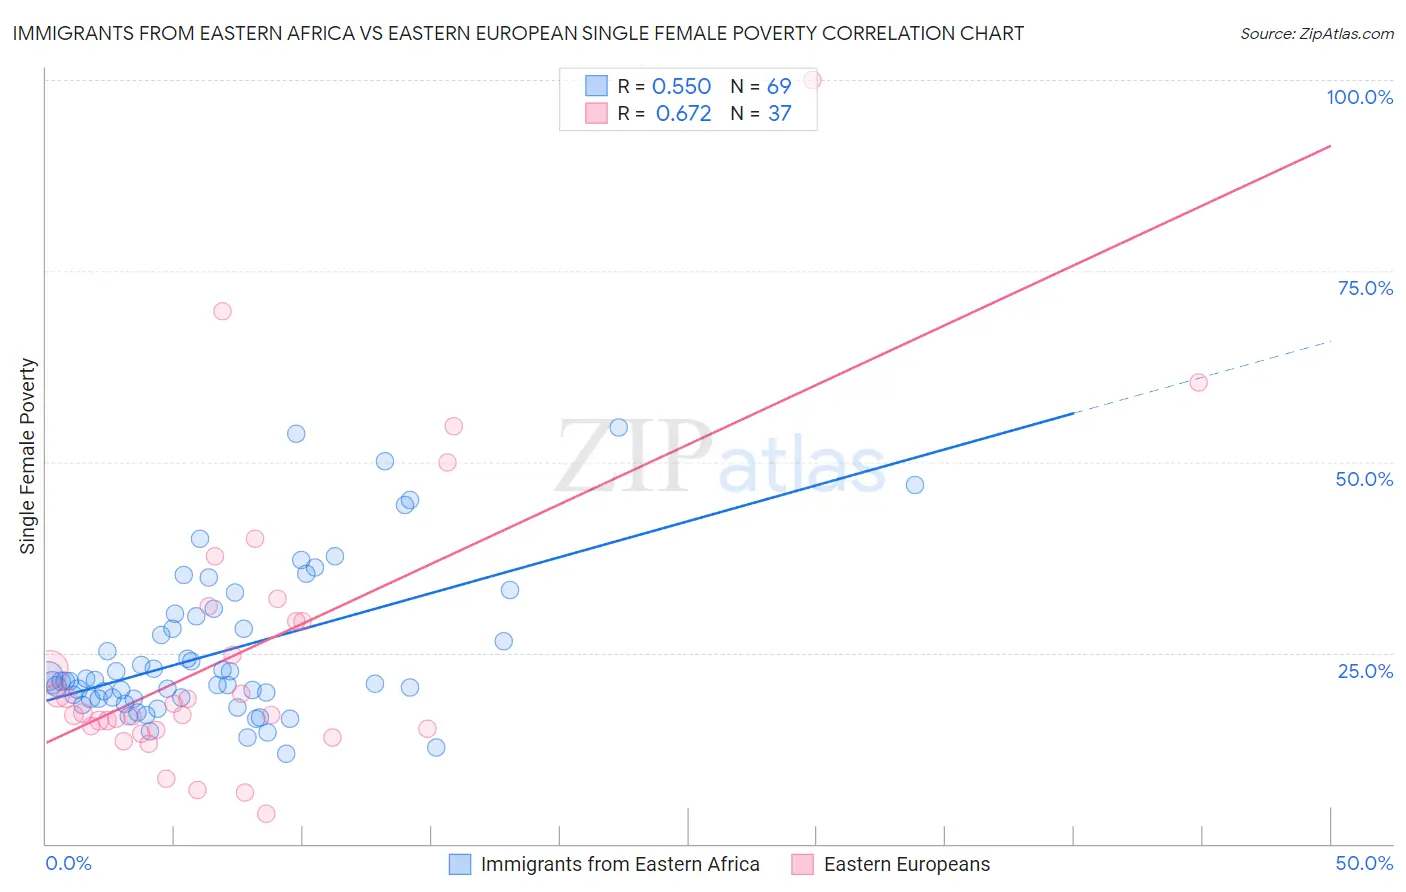
Immigrants from Eastern Africa vs Eastern European Single Female Poverty Correlation Chart
The statistical analysis conducted on geographies consisting of 351,272,292 people shows a substantial positive correlation between the proportion of Immigrants from Eastern Africa and poverty level among single females in the United States with a correlation coefficient (R) of 0.550 and weighted average of 21.6%. Similarly, the statistical analysis conducted on geographies consisting of 449,870,617 people shows a significant positive correlation between the proportion of Eastern Europeans and poverty level among single females in the United States with a correlation coefficient (R) of 0.672 and weighted average of 19.1%, a difference of 12.8%.
Single Female Poverty Correlation Summary
| Measurement | Immigrants from Eastern Africa | Eastern European |
| Minimum | 11.8% | 4.0% |
| Maximum | 54.5% | 100.0% |
| Range | 42.7% | 96.0% |
| Mean | 25.1% | 25.3% |
| Median | 21.3% | 17.2% |
| Interquartile 25% (IQ1) | 19.0% | 14.9% |
| Interquartile 75% (IQ3) | 29.9% | 30.1% |
| Interquartile Range (IQR) | 10.9% | 15.2% |
| Standard Deviation (Sample) | 9.9% | 19.6% |
| Standard Deviation (Population) | 9.8% | 19.3% |
Similar Demographics by Single Female Poverty
Demographics Similar to Immigrants from Eastern Africa by Single Female Poverty
In terms of single female poverty, the demographic groups most similar to Immigrants from Eastern Africa are Haitian (21.6%, a difference of 0.030%), Ghanaian (21.6%, a difference of 0.070%), Immigrants from Panama (21.6%, a difference of 0.090%), Belgian (21.5%, a difference of 0.11%), and Finnish (21.5%, a difference of 0.12%).
| Demographics | Rating | Rank | Single Female Poverty |
| Immigrants | Kenya | 20.7 /100 | #202 | Fair 21.4% |
| Immigrants | Haiti | 18.8 /100 | #203 | Poor 21.5% |
| Immigrants | Africa | 16.7 /100 | #204 | Poor 21.5% |
| Finns | 16.2 /100 | #205 | Poor 21.5% |
| Belgians | 16.1 /100 | #206 | Poor 21.5% |
| Ghanaians | 15.7 /100 | #207 | Poor 21.6% |
| Haitians | 15.4 /100 | #208 | Poor 21.6% |
| Immigrants | Eastern Africa | 15.1 /100 | #209 | Poor 21.6% |
| Immigrants | Panama | 14.4 /100 | #210 | Poor 21.6% |
| Icelanders | 14.0 /100 | #211 | Poor 21.6% |
| Jamaicans | 14.0 /100 | #212 | Poor 21.6% |
| Guamanians/Chamorros | 13.7 /100 | #213 | Poor 21.6% |
| Immigrants | Nicaragua | 13.3 /100 | #214 | Poor 21.6% |
| Ecuadorians | 12.3 /100 | #215 | Poor 21.6% |
| Immigrants | Barbados | 12.2 /100 | #216 | Poor 21.7% |
Demographics Similar to Eastern Europeans by Single Female Poverty
In terms of single female poverty, the demographic groups most similar to Eastern Europeans are Immigrants from Fiji (19.1%, a difference of 0.060%), Immigrants from Vietnam (19.1%, a difference of 0.11%), Immigrants from Bulgaria (19.1%, a difference of 0.12%), Argentinean (19.1%, a difference of 0.15%), and Tsimshian (19.1%, a difference of 0.16%).
| Demographics | Rating | Rank | Single Female Poverty |
| Immigrants | Eastern Europe | 99.8 /100 | #50 | Exceptional 19.0% |
| Immigrants | Italy | 99.8 /100 | #51 | Exceptional 19.0% |
| Egyptians | 99.7 /100 | #52 | Exceptional 19.1% |
| Tsimshian | 99.7 /100 | #53 | Exceptional 19.1% |
| Argentineans | 99.7 /100 | #54 | Exceptional 19.1% |
| Immigrants | Vietnam | 99.7 /100 | #55 | Exceptional 19.1% |
| Immigrants | Fiji | 99.7 /100 | #56 | Exceptional 19.1% |
| Eastern Europeans | 99.7 /100 | #57 | Exceptional 19.1% |
| Immigrants | Bulgaria | 99.7 /100 | #58 | Exceptional 19.1% |
| Sri Lankans | 99.6 /100 | #59 | Exceptional 19.2% |
| Russians | 99.6 /100 | #60 | Exceptional 19.2% |
| Cambodians | 99.6 /100 | #61 | Exceptional 19.2% |
| Lithuanians | 99.6 /100 | #62 | Exceptional 19.2% |
| Immigrants | Northern Europe | 99.6 /100 | #63 | Exceptional 19.2% |
| Immigrants | Europe | 99.6 /100 | #64 | Exceptional 19.2% |