Paraguayan vs Immigrants from Eastern Europe Single Female Poverty
COMPARE
Paraguayan
Immigrants from Eastern Europe
Single Female Poverty
Single Female Poverty Comparison
Paraguayans
Immigrants from Eastern Europe
19.3%
SINGLE FEMALE POVERTY
99.5/ 100
METRIC RATING
69th/ 347
METRIC RANK
19.0%
SINGLE FEMALE POVERTY
99.8/ 100
METRIC RATING
50th/ 347
METRIC RANK
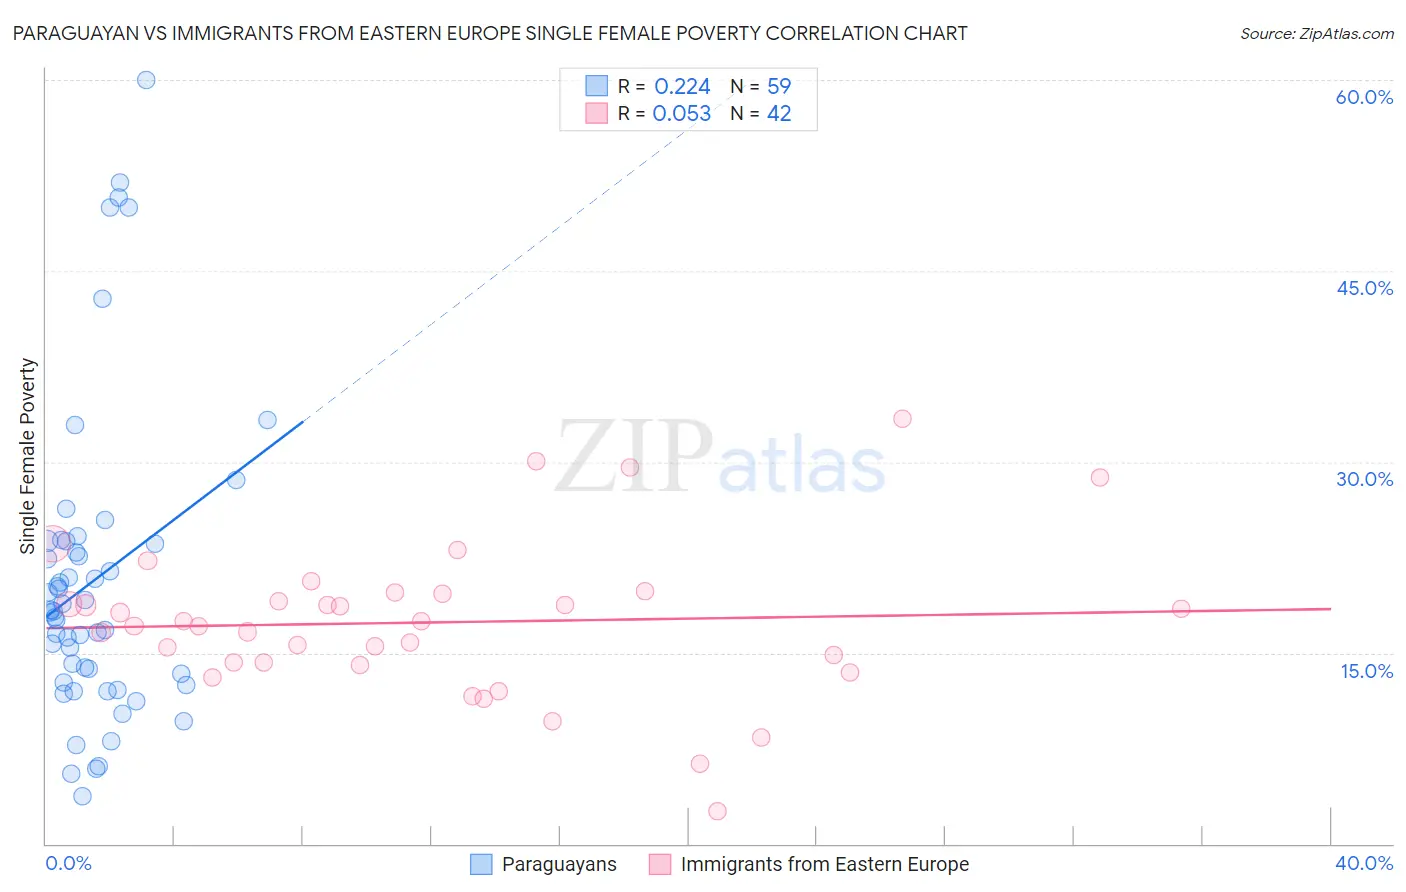
Paraguayan vs Immigrants from Eastern Europe Single Female Poverty Correlation Chart
The statistical analysis conducted on geographies consisting of 94,675,073 people shows a weak positive correlation between the proportion of Paraguayans and poverty level among single females in the United States with a correlation coefficient (R) of 0.224 and weighted average of 19.3%. Similarly, the statistical analysis conducted on geographies consisting of 464,074,222 people shows a slight positive correlation between the proportion of Immigrants from Eastern Europe and poverty level among single females in the United States with a correlation coefficient (R) of 0.053 and weighted average of 19.0%, a difference of 1.3%.
Single Female Poverty Correlation Summary
| Measurement | Paraguayan | Immigrants from Eastern Europe |
| Minimum | 3.7% | 2.5% |
| Maximum | 60.0% | 33.4% |
| Range | 56.3% | 30.9% |
| Mean | 20.7% | 17.4% |
| Median | 18.3% | 17.3% |
| Interquartile 25% (IQ1) | 12.7% | 14.2% |
| Interquartile 75% (IQ3) | 23.7% | 19.7% |
| Interquartile Range (IQR) | 11.0% | 5.5% |
| Standard Deviation (Sample) | 12.1% | 6.1% |
| Standard Deviation (Population) | 12.0% | 6.0% |
Demographics Similar to Paraguayans and Immigrants from Eastern Europe by Single Female Poverty
In terms of single female poverty, the demographic groups most similar to Paraguayans are Laotian (19.3%, a difference of 0.25%), Immigrants from Egypt (19.2%, a difference of 0.29%), Palestinian (19.2%, a difference of 0.33%), Cypriot (19.2%, a difference of 0.35%), and Immigrants from Europe (19.2%, a difference of 0.37%). Similarly, the demographic groups most similar to Immigrants from Eastern Europe are Immigrants from Czechoslovakia (19.0%, a difference of 0.040%), Immigrants from Italy (19.0%, a difference of 0.040%), Egyptian (19.1%, a difference of 0.080%), Tsimshian (19.1%, a difference of 0.29%), and Argentinean (19.1%, a difference of 0.30%).
| Demographics | Rating | Rank | Single Female Poverty |
| Immigrants | Czechoslovakia | 99.8 /100 | #49 | Exceptional 19.0% |
| Immigrants | Eastern Europe | 99.8 /100 | #50 | Exceptional 19.0% |
| Immigrants | Italy | 99.8 /100 | #51 | Exceptional 19.0% |
| Egyptians | 99.7 /100 | #52 | Exceptional 19.1% |
| Tsimshian | 99.7 /100 | #53 | Exceptional 19.1% |
| Argentineans | 99.7 /100 | #54 | Exceptional 19.1% |
| Immigrants | Vietnam | 99.7 /100 | #55 | Exceptional 19.1% |
| Immigrants | Fiji | 99.7 /100 | #56 | Exceptional 19.1% |
| Eastern Europeans | 99.7 /100 | #57 | Exceptional 19.1% |
| Immigrants | Bulgaria | 99.7 /100 | #58 | Exceptional 19.1% |
| Sri Lankans | 99.6 /100 | #59 | Exceptional 19.2% |
| Russians | 99.6 /100 | #60 | Exceptional 19.2% |
| Cambodians | 99.6 /100 | #61 | Exceptional 19.2% |
| Lithuanians | 99.6 /100 | #62 | Exceptional 19.2% |
| Immigrants | Northern Europe | 99.6 /100 | #63 | Exceptional 19.2% |
| Immigrants | Europe | 99.6 /100 | #64 | Exceptional 19.2% |
| Cypriots | 99.6 /100 | #65 | Exceptional 19.2% |
| Palestinians | 99.6 /100 | #66 | Exceptional 19.2% |
| Immigrants | Egypt | 99.6 /100 | #67 | Exceptional 19.2% |
| Laotians | 99.5 /100 | #68 | Exceptional 19.3% |
| Paraguayans | 99.5 /100 | #69 | Exceptional 19.3% |