Paraguayan vs Honduran Single Female Poverty
COMPARE
Paraguayan
Honduran
Single Female Poverty
Single Female Poverty Comparison
Paraguayans
Hondurans
19.3%
SINGLE FEMALE POVERTY
99.5/ 100
METRIC RATING
69th/ 347
METRIC RANK
25.1%
SINGLE FEMALE POVERTY
0.0/ 100
METRIC RATING
301st/ 347
METRIC RANK
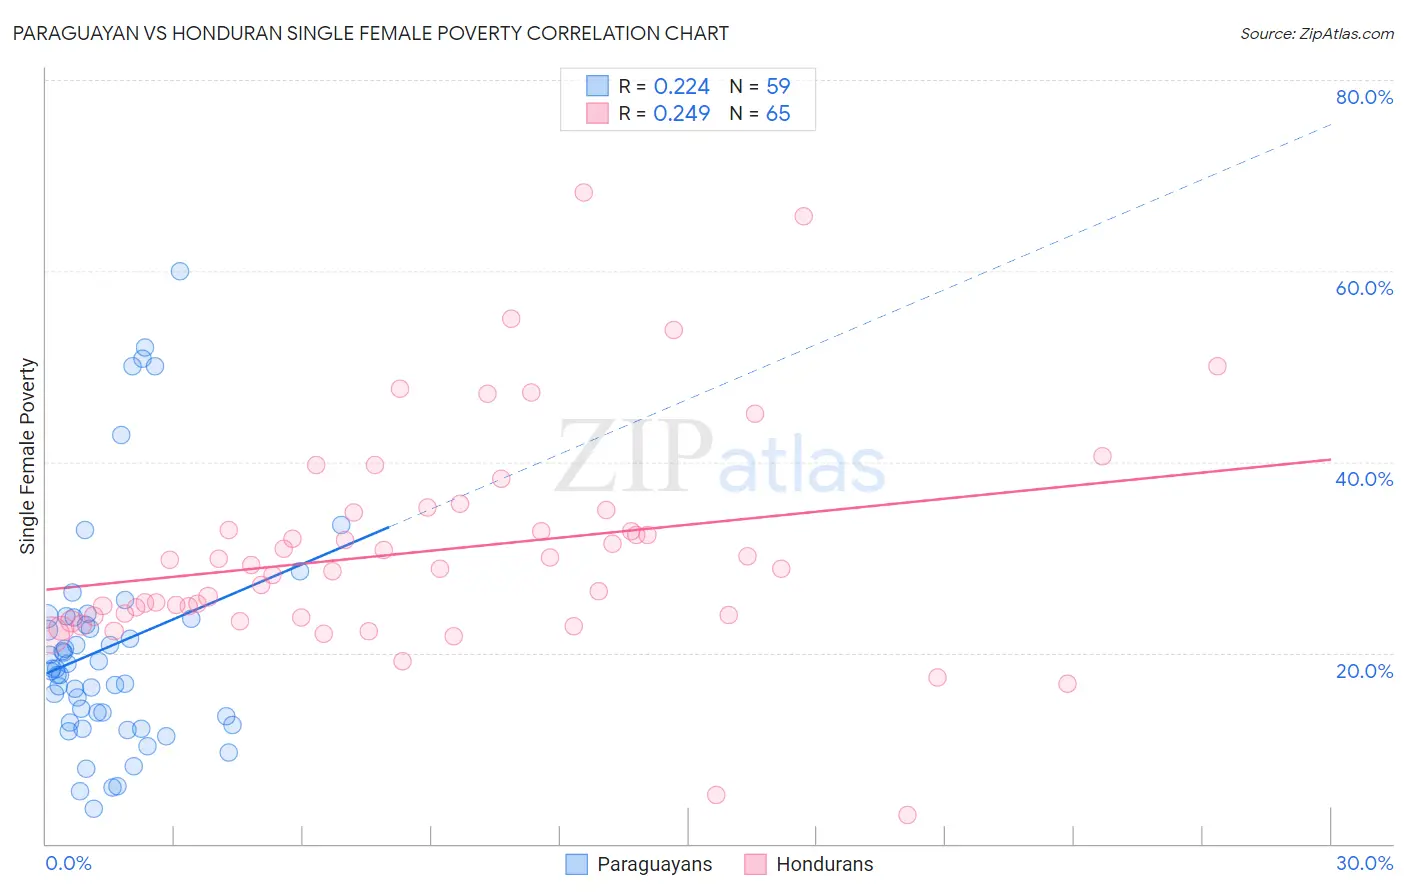
Paraguayan vs Honduran Single Female Poverty Correlation Chart
The statistical analysis conducted on geographies consisting of 94,675,073 people shows a weak positive correlation between the proportion of Paraguayans and poverty level among single females in the United States with a correlation coefficient (R) of 0.224 and weighted average of 19.3%. Similarly, the statistical analysis conducted on geographies consisting of 354,754,258 people shows a weak positive correlation between the proportion of Hondurans and poverty level among single females in the United States with a correlation coefficient (R) of 0.249 and weighted average of 25.1%, a difference of 30.1%.
Single Female Poverty Correlation Summary
| Measurement | Paraguayan | Honduran |
| Minimum | 3.7% | 3.0% |
| Maximum | 60.0% | 68.3% |
| Range | 56.3% | 65.3% |
| Mean | 20.7% | 30.7% |
| Median | 18.3% | 28.8% |
| Interquartile 25% (IQ1) | 12.7% | 23.8% |
| Interquartile 75% (IQ3) | 23.7% | 34.8% |
| Interquartile Range (IQR) | 11.0% | 11.0% |
| Standard Deviation (Sample) | 12.1% | 11.6% |
| Standard Deviation (Population) | 12.0% | 11.6% |
Similar Demographics by Single Female Poverty
Demographics Similar to Paraguayans by Single Female Poverty
In terms of single female poverty, the demographic groups most similar to Paraguayans are Immigrants from Jordan (19.3%, a difference of 0.060%), Immigrants from South Eastern Asia (19.3%, a difference of 0.13%), Immigrants from Latvia (19.3%, a difference of 0.14%), Immigrants from Peru (19.3%, a difference of 0.23%), and Laotian (19.3%, a difference of 0.25%).
| Demographics | Rating | Rank | Single Female Poverty |
| Lithuanians | 99.6 /100 | #62 | Exceptional 19.2% |
| Immigrants | Northern Europe | 99.6 /100 | #63 | Exceptional 19.2% |
| Immigrants | Europe | 99.6 /100 | #64 | Exceptional 19.2% |
| Cypriots | 99.6 /100 | #65 | Exceptional 19.2% |
| Palestinians | 99.6 /100 | #66 | Exceptional 19.2% |
| Immigrants | Egypt | 99.6 /100 | #67 | Exceptional 19.2% |
| Laotians | 99.5 /100 | #68 | Exceptional 19.3% |
| Paraguayans | 99.5 /100 | #69 | Exceptional 19.3% |
| Immigrants | Jordan | 99.4 /100 | #70 | Exceptional 19.3% |
| Immigrants | South Eastern Asia | 99.4 /100 | #71 | Exceptional 19.3% |
| Immigrants | Latvia | 99.4 /100 | #72 | Exceptional 19.3% |
| Immigrants | Peru | 99.4 /100 | #73 | Exceptional 19.3% |
| Immigrants | Belarus | 99.4 /100 | #74 | Exceptional 19.3% |
| Immigrants | Turkey | 99.4 /100 | #75 | Exceptional 19.4% |
| Peruvians | 99.4 /100 | #76 | Exceptional 19.4% |
Demographics Similar to Hondurans by Single Female Poverty
In terms of single female poverty, the demographic groups most similar to Hondurans are Shoshone (25.1%, a difference of 0.090%), Blackfeet (25.1%, a difference of 0.18%), Mexican (25.0%, a difference of 0.25%), Somali (25.2%, a difference of 0.48%), and Immigrants from Congo (25.3%, a difference of 0.75%).
| Demographics | Rating | Rank | Single Female Poverty |
| French American Indians | 0.0 /100 | #294 | Tragic 24.6% |
| Hispanics or Latinos | 0.0 /100 | #295 | Tragic 24.6% |
| Africans | 0.0 /100 | #296 | Tragic 24.8% |
| Immigrants | Central America | 0.0 /100 | #297 | Tragic 24.8% |
| Yaqui | 0.0 /100 | #298 | Tragic 24.9% |
| Mexicans | 0.0 /100 | #299 | Tragic 25.0% |
| Blackfeet | 0.0 /100 | #300 | Tragic 25.1% |
| Hondurans | 0.0 /100 | #301 | Tragic 25.1% |
| Shoshone | 0.0 /100 | #302 | Tragic 25.1% |
| Somalis | 0.0 /100 | #303 | Tragic 25.2% |
| Immigrants | Congo | 0.0 /100 | #304 | Tragic 25.3% |
| Immigrants | Dominican Republic | 0.0 /100 | #305 | Tragic 25.3% |
| Immigrants | Mexico | 0.0 /100 | #306 | Tragic 25.3% |
| Potawatomi | 0.0 /100 | #307 | Tragic 25.4% |
| Aleuts | 0.0 /100 | #308 | Tragic 25.4% |