Paraguayan vs Eastern European Family Poverty
COMPARE
Paraguayan
Eastern European
Family Poverty
Family Poverty Comparison
Paraguayans
Eastern Europeans
8.3%
FAMILY POVERTY
91.2/ 100
METRIC RATING
122nd/ 347
METRIC RANK
7.2%
FAMILY POVERTY
99.7/ 100
METRIC RATING
19th/ 347
METRIC RANK
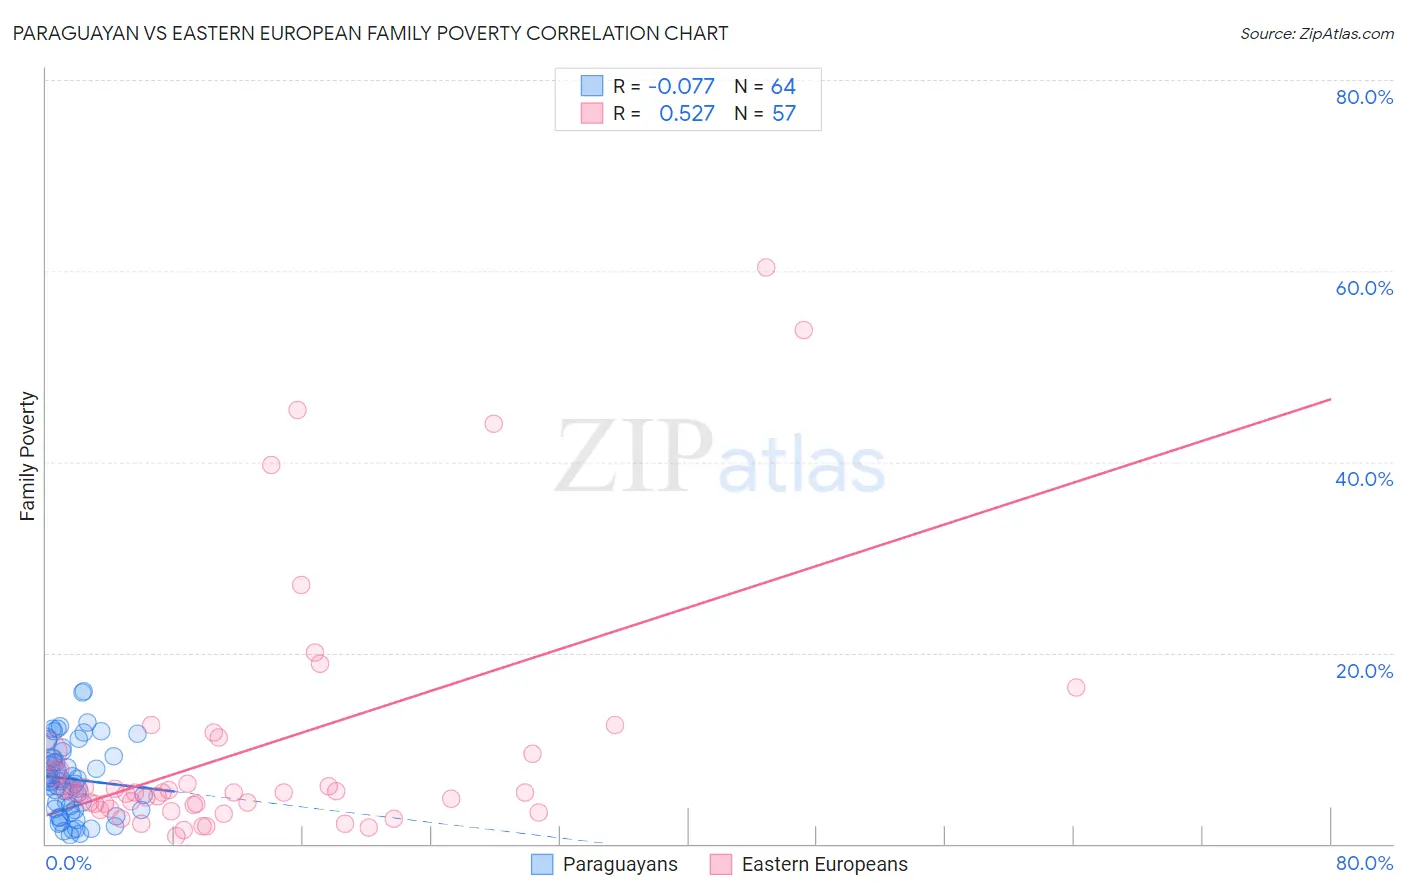
Paraguayan vs Eastern European Family Poverty Correlation Chart
The statistical analysis conducted on geographies consisting of 95,035,993 people shows a slight negative correlation between the proportion of Paraguayans and poverty level among families in the United States with a correlation coefficient (R) of -0.077 and weighted average of 8.3%. Similarly, the statistical analysis conducted on geographies consisting of 459,080,941 people shows a substantial positive correlation between the proportion of Eastern Europeans and poverty level among families in the United States with a correlation coefficient (R) of 0.527 and weighted average of 7.2%, a difference of 14.8%.
Family Poverty Correlation Summary
| Measurement | Paraguayan | Eastern European |
| Minimum | 0.93% | 0.82% |
| Maximum | 16.0% | 60.3% |
| Range | 15.0% | 59.5% |
| Mean | 6.8% | 10.1% |
| Median | 6.6% | 5.3% |
| Interquartile 25% (IQ1) | 3.6% | 3.8% |
| Interquartile 75% (IQ3) | 9.1% | 9.6% |
| Interquartile Range (IQR) | 5.5% | 5.7% |
| Standard Deviation (Sample) | 3.7% | 13.2% |
| Standard Deviation (Population) | 3.7% | 13.1% |
Similar Demographics by Family Poverty
Demographics Similar to Paraguayans by Family Poverty
In terms of family poverty, the demographic groups most similar to Paraguayans are Native Hawaiian (8.3%, a difference of 0.010%), Palestinian (8.3%, a difference of 0.070%), Soviet Union (8.3%, a difference of 0.17%), Immigrants from Egypt (8.3%, a difference of 0.18%), and Pakistani (8.3%, a difference of 0.21%).
| Demographics | Rating | Rank | Family Poverty |
| Immigrants | Israel | 93.5 /100 | #115 | Exceptional 8.2% |
| South Africans | 93.4 /100 | #116 | Exceptional 8.2% |
| Immigrants | Russia | 93.2 /100 | #117 | Exceptional 8.2% |
| Immigrants | Western Europe | 92.9 /100 | #118 | Exceptional 8.2% |
| French | 92.8 /100 | #119 | Exceptional 8.3% |
| Immigrants | Egypt | 91.6 /100 | #120 | Exceptional 8.3% |
| Native Hawaiians | 91.3 /100 | #121 | Exceptional 8.3% |
| Paraguayans | 91.2 /100 | #122 | Exceptional 8.3% |
| Palestinians | 91.1 /100 | #123 | Exceptional 8.3% |
| Soviet Union | 90.8 /100 | #124 | Exceptional 8.3% |
| Pakistanis | 90.8 /100 | #125 | Exceptional 8.3% |
| Icelanders | 90.3 /100 | #126 | Exceptional 8.3% |
| Immigrants | Hungary | 89.9 /100 | #127 | Excellent 8.4% |
| Argentineans | 89.6 /100 | #128 | Excellent 8.4% |
| Portuguese | 89.2 /100 | #129 | Excellent 8.4% |
Demographics Similar to Eastern Europeans by Family Poverty
In terms of family poverty, the demographic groups most similar to Eastern Europeans are Immigrants from Hong Kong (7.3%, a difference of 0.16%), Immigrants from Lithuania (7.2%, a difference of 0.30%), Luxembourger (7.2%, a difference of 0.31%), Immigrants from Iran (7.3%, a difference of 0.36%), and Immigrants from South Central Asia (7.2%, a difference of 0.54%).
| Demographics | Rating | Rank | Family Poverty |
| Maltese | 99.8 /100 | #12 | Exceptional 7.1% |
| Swedes | 99.8 /100 | #13 | Exceptional 7.1% |
| Iranians | 99.8 /100 | #14 | Exceptional 7.1% |
| Lithuanians | 99.8 /100 | #15 | Exceptional 7.2% |
| Immigrants | South Central Asia | 99.8 /100 | #16 | Exceptional 7.2% |
| Luxembourgers | 99.8 /100 | #17 | Exceptional 7.2% |
| Immigrants | Lithuania | 99.8 /100 | #18 | Exceptional 7.2% |
| Eastern Europeans | 99.7 /100 | #19 | Exceptional 7.2% |
| Immigrants | Hong Kong | 99.7 /100 | #20 | Exceptional 7.3% |
| Immigrants | Iran | 99.7 /100 | #21 | Exceptional 7.3% |
| Danes | 99.7 /100 | #22 | Exceptional 7.3% |
| Assyrians/Chaldeans/Syriacs | 99.7 /100 | #23 | Exceptional 7.3% |
| Croatians | 99.7 /100 | #24 | Exceptional 7.3% |
| Burmese | 99.7 /100 | #25 | Exceptional 7.3% |
| Cypriots | 99.6 /100 | #26 | Exceptional 7.3% |