Burmese vs Eastern European Single Female Poverty
COMPARE
Burmese
Eastern European
Single Female Poverty
Single Female Poverty Comparison
Burmese
Eastern Europeans
18.3%
SINGLE FEMALE POVERTY
100.0/ 100
METRIC RATING
22nd/ 347
METRIC RANK
19.1%
SINGLE FEMALE POVERTY
99.7/ 100
METRIC RATING
57th/ 347
METRIC RANK
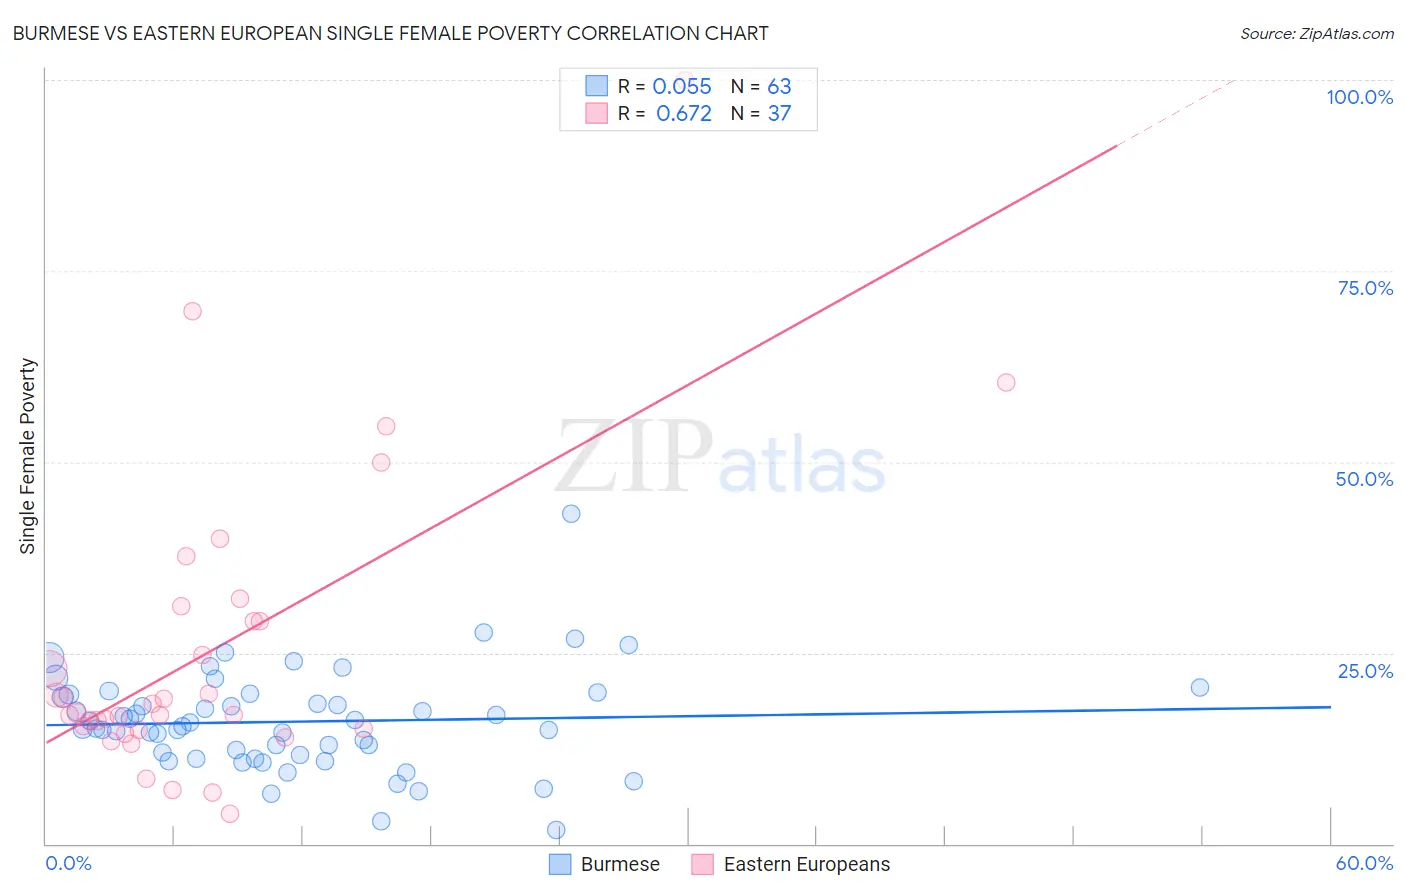
Burmese vs Eastern European Single Female Poverty Correlation Chart
The statistical analysis conducted on geographies consisting of 455,450,200 people shows a slight positive correlation between the proportion of Burmese and poverty level among single females in the United States with a correlation coefficient (R) of 0.055 and weighted average of 18.3%. Similarly, the statistical analysis conducted on geographies consisting of 449,870,617 people shows a significant positive correlation between the proportion of Eastern Europeans and poverty level among single females in the United States with a correlation coefficient (R) of 0.672 and weighted average of 19.1%, a difference of 4.6%.
Single Female Poverty Correlation Summary
| Measurement | Burmese | Eastern European |
| Minimum | 1.8% | 4.0% |
| Maximum | 43.2% | 100.0% |
| Range | 41.3% | 96.0% |
| Mean | 16.0% | 25.3% |
| Median | 15.4% | 17.2% |
| Interquartile 25% (IQ1) | 11.7% | 14.9% |
| Interquartile 75% (IQ3) | 19.5% | 30.1% |
| Interquartile Range (IQR) | 7.9% | 15.2% |
| Standard Deviation (Sample) | 6.6% | 19.6% |
| Standard Deviation (Population) | 6.5% | 19.3% |
Similar Demographics by Single Female Poverty
Demographics Similar to Burmese by Single Female Poverty
In terms of single female poverty, the demographic groups most similar to Burmese are Asian (18.3%, a difference of 0.0%), Maltese (18.3%, a difference of 0.010%), Immigrants from Greece (18.3%, a difference of 0.070%), Armenian (18.3%, a difference of 0.23%), and Immigrants from Singapore (18.3%, a difference of 0.33%).
| Demographics | Rating | Rank | Single Female Poverty |
| Indians (Asian) | 100.0 /100 | #15 | Exceptional 17.9% |
| Iranians | 100.0 /100 | #16 | Exceptional 18.0% |
| Immigrants | Korea | 100.0 /100 | #17 | Exceptional 18.1% |
| Immigrants | Eastern Asia | 100.0 /100 | #18 | Exceptional 18.1% |
| Immigrants | China | 100.0 /100 | #19 | Exceptional 18.1% |
| Immigrants | Greece | 100.0 /100 | #20 | Exceptional 18.3% |
| Maltese | 100.0 /100 | #21 | Exceptional 18.3% |
| Burmese | 100.0 /100 | #22 | Exceptional 18.3% |
| Asians | 100.0 /100 | #23 | Exceptional 18.3% |
| Armenians | 100.0 /100 | #24 | Exceptional 18.3% |
| Immigrants | Singapore | 100.0 /100 | #25 | Exceptional 18.3% |
| Immigrants | Israel | 100.0 /100 | #26 | Exceptional 18.3% |
| Immigrants | Pakistan | 100.0 /100 | #27 | Exceptional 18.4% |
| Immigrants | Moldova | 100.0 /100 | #28 | Exceptional 18.5% |
| Immigrants | Poland | 100.0 /100 | #29 | Exceptional 18.5% |
Demographics Similar to Eastern Europeans by Single Female Poverty
In terms of single female poverty, the demographic groups most similar to Eastern Europeans are Immigrants from Fiji (19.1%, a difference of 0.060%), Immigrants from Vietnam (19.1%, a difference of 0.11%), Immigrants from Bulgaria (19.1%, a difference of 0.12%), Argentinean (19.1%, a difference of 0.15%), and Tsimshian (19.1%, a difference of 0.16%).
| Demographics | Rating | Rank | Single Female Poverty |
| Immigrants | Eastern Europe | 99.8 /100 | #50 | Exceptional 19.0% |
| Immigrants | Italy | 99.8 /100 | #51 | Exceptional 19.0% |
| Egyptians | 99.7 /100 | #52 | Exceptional 19.1% |
| Tsimshian | 99.7 /100 | #53 | Exceptional 19.1% |
| Argentineans | 99.7 /100 | #54 | Exceptional 19.1% |
| Immigrants | Vietnam | 99.7 /100 | #55 | Exceptional 19.1% |
| Immigrants | Fiji | 99.7 /100 | #56 | Exceptional 19.1% |
| Eastern Europeans | 99.7 /100 | #57 | Exceptional 19.1% |
| Immigrants | Bulgaria | 99.7 /100 | #58 | Exceptional 19.1% |
| Sri Lankans | 99.6 /100 | #59 | Exceptional 19.2% |
| Russians | 99.6 /100 | #60 | Exceptional 19.2% |
| Cambodians | 99.6 /100 | #61 | Exceptional 19.2% |
| Lithuanians | 99.6 /100 | #62 | Exceptional 19.2% |
| Immigrants | Northern Europe | 99.6 /100 | #63 | Exceptional 19.2% |
| Immigrants | Europe | 99.6 /100 | #64 | Exceptional 19.2% |