Immigrants from South America vs Eastern European Single Female Poverty
COMPARE
Immigrants from South America
Eastern European
Single Female Poverty
Single Female Poverty Comparison
Immigrants from South America
Eastern Europeans
20.0%
SINGLE FEMALE POVERTY
95.0/ 100
METRIC RATING
122nd/ 347
METRIC RANK
19.1%
SINGLE FEMALE POVERTY
99.7/ 100
METRIC RATING
57th/ 347
METRIC RANK
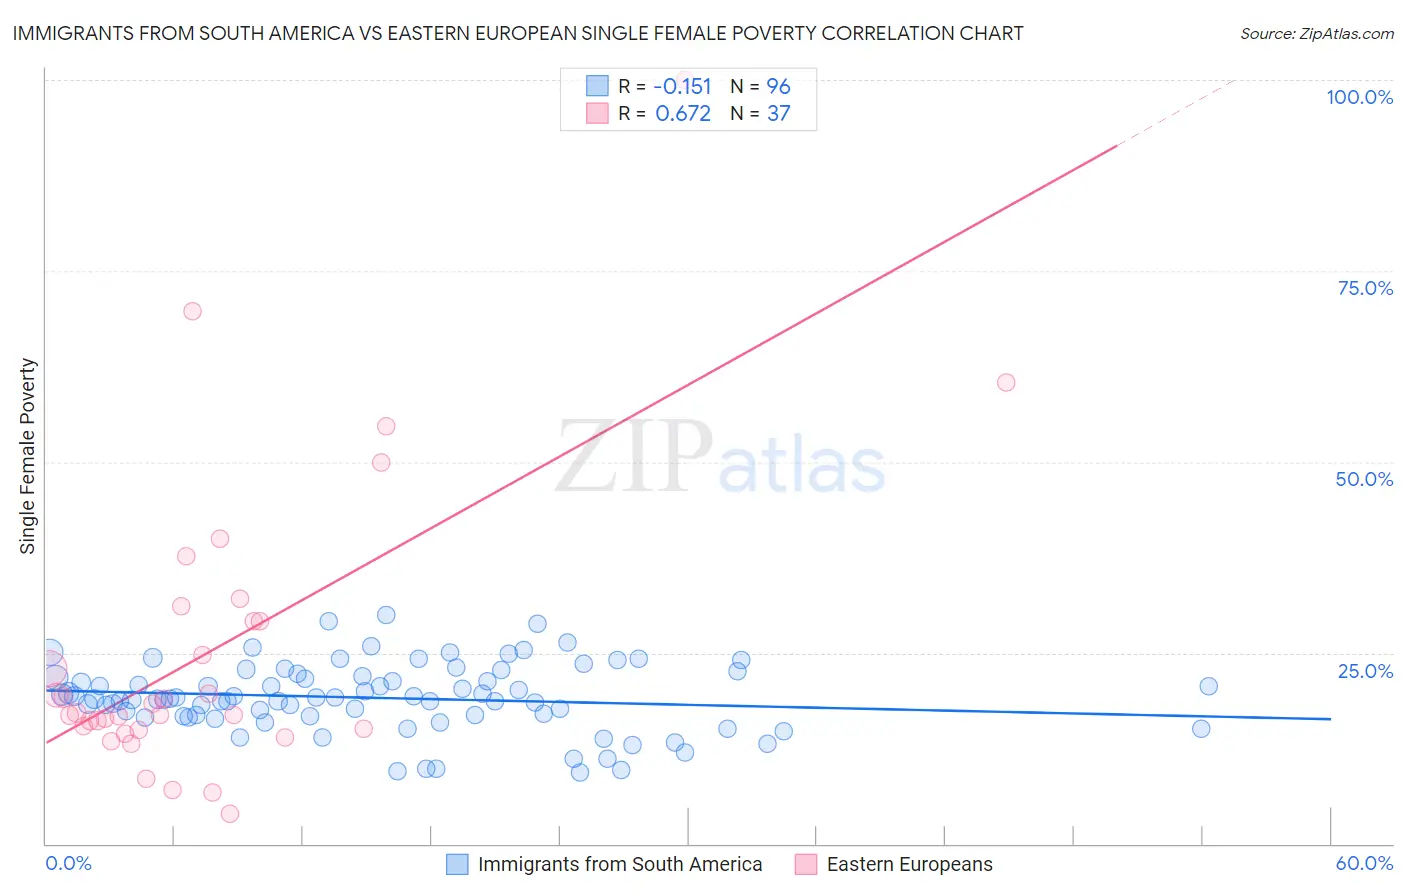
Immigrants from South America vs Eastern European Single Female Poverty Correlation Chart
The statistical analysis conducted on geographies consisting of 475,439,671 people shows a poor negative correlation between the proportion of Immigrants from South America and poverty level among single females in the United States with a correlation coefficient (R) of -0.151 and weighted average of 20.0%. Similarly, the statistical analysis conducted on geographies consisting of 449,870,617 people shows a significant positive correlation between the proportion of Eastern Europeans and poverty level among single females in the United States with a correlation coefficient (R) of 0.672 and weighted average of 19.1%, a difference of 4.8%.
Single Female Poverty Correlation Summary
| Measurement | Immigrants from South America | Eastern European |
| Minimum | 9.4% | 4.0% |
| Maximum | 30.0% | 100.0% |
| Range | 20.6% | 96.0% |
| Mean | 19.1% | 25.3% |
| Median | 19.0% | 17.2% |
| Interquartile 25% (IQ1) | 16.6% | 14.9% |
| Interquartile 75% (IQ3) | 21.9% | 30.1% |
| Interquartile Range (IQR) | 5.2% | 15.2% |
| Standard Deviation (Sample) | 4.4% | 19.6% |
| Standard Deviation (Population) | 4.4% | 19.3% |
Similar Demographics by Single Female Poverty
Demographics Similar to Immigrants from South America by Single Female Poverty
In terms of single female poverty, the demographic groups most similar to Immigrants from South America are Immigrants from Switzerland (20.0%, a difference of 0.030%), South American (20.0%, a difference of 0.060%), Immigrants from Afghanistan (20.0%, a difference of 0.16%), Immigrants from Ethiopia (20.0%, a difference of 0.16%), and Brazilian (20.1%, a difference of 0.18%).
| Demographics | Rating | Rank | Single Female Poverty |
| Immigrants | Northern Africa | 95.8 /100 | #115 | Exceptional 20.0% |
| Immigrants | Kazakhstan | 95.7 /100 | #116 | Exceptional 20.0% |
| Poles | 95.6 /100 | #117 | Exceptional 20.0% |
| Immigrants | Afghanistan | 95.4 /100 | #118 | Exceptional 20.0% |
| Immigrants | Ethiopia | 95.4 /100 | #119 | Exceptional 20.0% |
| South Americans | 95.1 /100 | #120 | Exceptional 20.0% |
| Immigrants | Switzerland | 95.1 /100 | #121 | Exceptional 20.0% |
| Immigrants | South America | 95.0 /100 | #122 | Exceptional 20.0% |
| Brazilians | 94.4 /100 | #123 | Exceptional 20.1% |
| Immigrants | Chile | 94.3 /100 | #124 | Exceptional 20.1% |
| Immigrants | South Africa | 93.9 /100 | #125 | Exceptional 20.1% |
| Serbians | 93.3 /100 | #126 | Exceptional 20.1% |
| Mongolians | 93.2 /100 | #127 | Exceptional 20.2% |
| Immigrants | Spain | 92.7 /100 | #128 | Exceptional 20.2% |
| Immigrants | Morocco | 92.4 /100 | #129 | Exceptional 20.2% |
Demographics Similar to Eastern Europeans by Single Female Poverty
In terms of single female poverty, the demographic groups most similar to Eastern Europeans are Immigrants from Fiji (19.1%, a difference of 0.060%), Immigrants from Vietnam (19.1%, a difference of 0.11%), Immigrants from Bulgaria (19.1%, a difference of 0.12%), Argentinean (19.1%, a difference of 0.15%), and Tsimshian (19.1%, a difference of 0.16%).
| Demographics | Rating | Rank | Single Female Poverty |
| Immigrants | Eastern Europe | 99.8 /100 | #50 | Exceptional 19.0% |
| Immigrants | Italy | 99.8 /100 | #51 | Exceptional 19.0% |
| Egyptians | 99.7 /100 | #52 | Exceptional 19.1% |
| Tsimshian | 99.7 /100 | #53 | Exceptional 19.1% |
| Argentineans | 99.7 /100 | #54 | Exceptional 19.1% |
| Immigrants | Vietnam | 99.7 /100 | #55 | Exceptional 19.1% |
| Immigrants | Fiji | 99.7 /100 | #56 | Exceptional 19.1% |
| Eastern Europeans | 99.7 /100 | #57 | Exceptional 19.1% |
| Immigrants | Bulgaria | 99.7 /100 | #58 | Exceptional 19.1% |
| Sri Lankans | 99.6 /100 | #59 | Exceptional 19.2% |
| Russians | 99.6 /100 | #60 | Exceptional 19.2% |
| Cambodians | 99.6 /100 | #61 | Exceptional 19.2% |
| Lithuanians | 99.6 /100 | #62 | Exceptional 19.2% |
| Immigrants | Northern Europe | 99.6 /100 | #63 | Exceptional 19.2% |
| Immigrants | Europe | 99.6 /100 | #64 | Exceptional 19.2% |