Paraguayan vs Immigrants from Latvia Single Female Poverty
COMPARE
Paraguayan
Immigrants from Latvia
Single Female Poverty
Single Female Poverty Comparison
Paraguayans
Immigrants from Latvia
19.3%
SINGLE FEMALE POVERTY
99.5/ 100
METRIC RATING
69th/ 347
METRIC RANK
19.3%
SINGLE FEMALE POVERTY
99.4/ 100
METRIC RATING
72nd/ 347
METRIC RANK
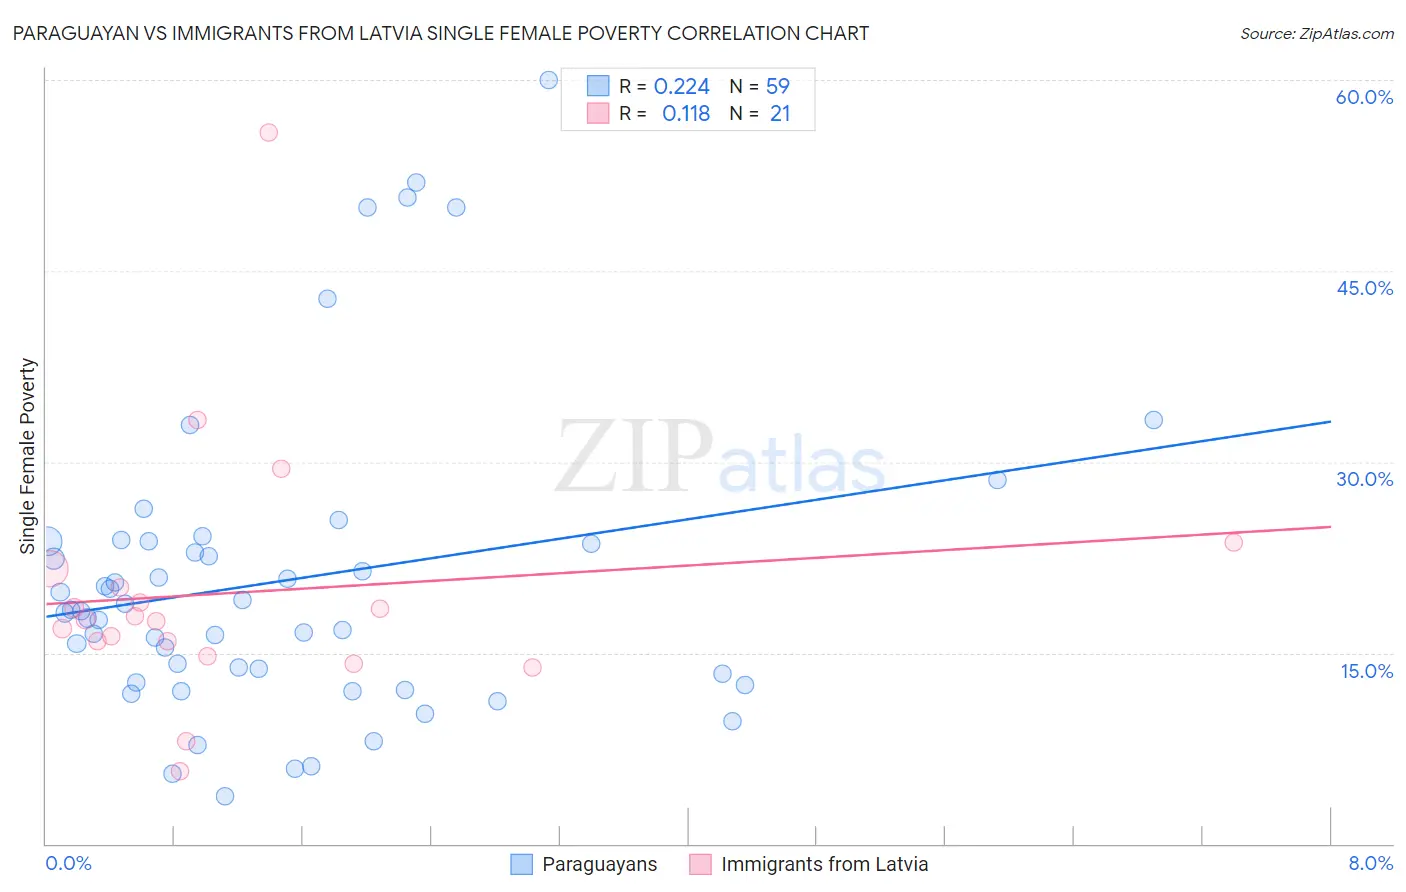
Paraguayan vs Immigrants from Latvia Single Female Poverty Correlation Chart
The statistical analysis conducted on geographies consisting of 94,675,073 people shows a weak positive correlation between the proportion of Paraguayans and poverty level among single females in the United States with a correlation coefficient (R) of 0.224 and weighted average of 19.3%. Similarly, the statistical analysis conducted on geographies consisting of 112,952,917 people shows a poor positive correlation between the proportion of Immigrants from Latvia and poverty level among single females in the United States with a correlation coefficient (R) of 0.118 and weighted average of 19.3%, a difference of 0.14%.
Single Female Poverty Correlation Summary
| Measurement | Paraguayan | Immigrants from Latvia |
| Minimum | 3.7% | 5.7% |
| Maximum | 60.0% | 55.9% |
| Range | 56.3% | 50.1% |
| Mean | 20.7% | 19.7% |
| Median | 18.3% | 17.6% |
| Interquartile 25% (IQ1) | 12.7% | 15.3% |
| Interquartile 75% (IQ3) | 23.7% | 20.9% |
| Interquartile Range (IQR) | 11.0% | 5.6% |
| Standard Deviation (Sample) | 12.1% | 10.2% |
| Standard Deviation (Population) | 12.0% | 10.0% |
Demographics Similar to Paraguayans and Immigrants from Latvia by Single Female Poverty
In terms of single female poverty, the demographic groups most similar to Paraguayans are Immigrants from Jordan (19.3%, a difference of 0.060%), Immigrants from South Eastern Asia (19.3%, a difference of 0.13%), Immigrants from Peru (19.3%, a difference of 0.23%), Laotian (19.3%, a difference of 0.25%), and Immigrants from Belarus (19.3%, a difference of 0.25%). Similarly, the demographic groups most similar to Immigrants from Latvia are Immigrants from South Eastern Asia (19.3%, a difference of 0.0%), Immigrants from Jordan (19.3%, a difference of 0.070%), Immigrants from Peru (19.3%, a difference of 0.10%), Immigrants from Belarus (19.3%, a difference of 0.11%), and Immigrants from Turkey (19.4%, a difference of 0.15%).
| Demographics | Rating | Rank | Single Female Poverty |
| Russians | 99.6 /100 | #60 | Exceptional 19.2% |
| Cambodians | 99.6 /100 | #61 | Exceptional 19.2% |
| Lithuanians | 99.6 /100 | #62 | Exceptional 19.2% |
| Immigrants | Northern Europe | 99.6 /100 | #63 | Exceptional 19.2% |
| Immigrants | Europe | 99.6 /100 | #64 | Exceptional 19.2% |
| Cypriots | 99.6 /100 | #65 | Exceptional 19.2% |
| Palestinians | 99.6 /100 | #66 | Exceptional 19.2% |
| Immigrants | Egypt | 99.6 /100 | #67 | Exceptional 19.2% |
| Laotians | 99.5 /100 | #68 | Exceptional 19.3% |
| Paraguayans | 99.5 /100 | #69 | Exceptional 19.3% |
| Immigrants | Jordan | 99.4 /100 | #70 | Exceptional 19.3% |
| Immigrants | South Eastern Asia | 99.4 /100 | #71 | Exceptional 19.3% |
| Immigrants | Latvia | 99.4 /100 | #72 | Exceptional 19.3% |
| Immigrants | Peru | 99.4 /100 | #73 | Exceptional 19.3% |
| Immigrants | Belarus | 99.4 /100 | #74 | Exceptional 19.3% |
| Immigrants | Turkey | 99.4 /100 | #75 | Exceptional 19.4% |
| Peruvians | 99.4 /100 | #76 | Exceptional 19.4% |
| Immigrants | Russia | 99.3 /100 | #77 | Exceptional 19.4% |
| Albanians | 99.3 /100 | #78 | Exceptional 19.4% |
| Immigrants | Sierra Leone | 99.3 /100 | #79 | Exceptional 19.4% |
| Immigrants | Australia | 99.3 /100 | #80 | Exceptional 19.4% |