Immigrants from South Central Asia vs Eastern European Single Female Poverty
COMPARE
Immigrants from South Central Asia
Eastern European
Single Female Poverty
Single Female Poverty Comparison
Immigrants from South Central Asia
Eastern Europeans
17.8%
SINGLE FEMALE POVERTY
100.0/ 100
METRIC RATING
12th/ 347
METRIC RANK
19.1%
SINGLE FEMALE POVERTY
99.7/ 100
METRIC RATING
57th/ 347
METRIC RANK
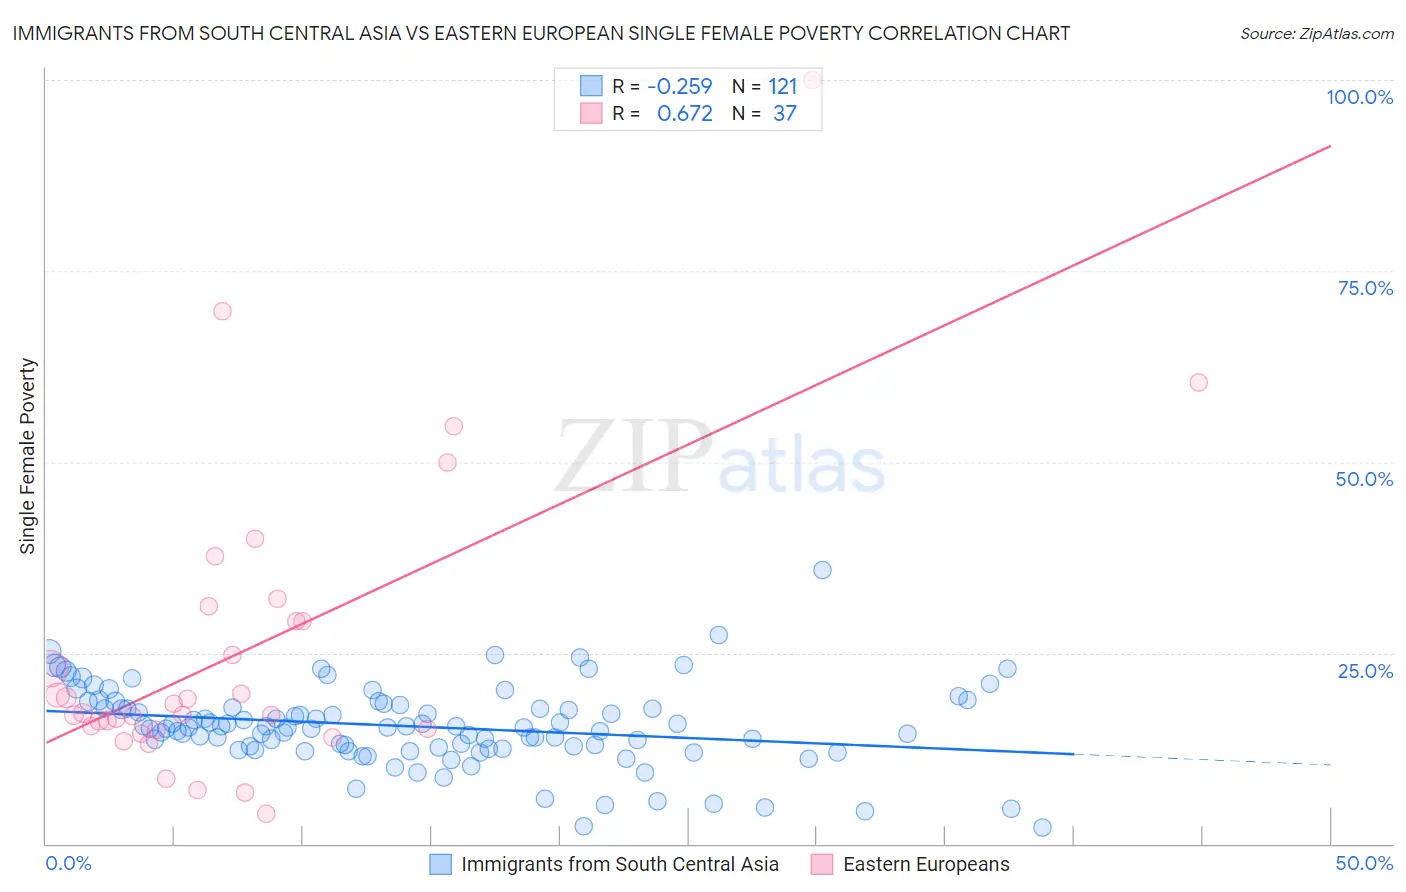
Immigrants from South Central Asia vs Eastern European Single Female Poverty Correlation Chart
The statistical analysis conducted on geographies consisting of 462,698,377 people shows a weak negative correlation between the proportion of Immigrants from South Central Asia and poverty level among single females in the United States with a correlation coefficient (R) of -0.259 and weighted average of 17.8%. Similarly, the statistical analysis conducted on geographies consisting of 449,870,617 people shows a significant positive correlation between the proportion of Eastern Europeans and poverty level among single females in the United States with a correlation coefficient (R) of 0.672 and weighted average of 19.1%, a difference of 7.5%.
Single Female Poverty Correlation Summary
| Measurement | Immigrants from South Central Asia | Eastern European |
| Minimum | 2.0% | 4.0% |
| Maximum | 35.8% | 100.0% |
| Range | 33.8% | 96.0% |
| Mean | 15.4% | 25.3% |
| Median | 15.2% | 17.2% |
| Interquartile 25% (IQ1) | 12.5% | 14.9% |
| Interquartile 75% (IQ3) | 18.0% | 30.1% |
| Interquartile Range (IQR) | 5.4% | 15.2% |
| Standard Deviation (Sample) | 5.2% | 19.6% |
| Standard Deviation (Population) | 5.2% | 19.3% |
Similar Demographics by Single Female Poverty
Demographics Similar to Immigrants from South Central Asia by Single Female Poverty
In terms of single female poverty, the demographic groups most similar to Immigrants from South Central Asia are Immigrants from Lithuania (17.8%, a difference of 0.060%), Immigrants from Ireland (17.8%, a difference of 0.15%), Immigrants from Bolivia (17.8%, a difference of 0.26%), Bhutanese (17.7%, a difference of 0.56%), and Bolivian (17.9%, a difference of 0.70%).
| Demographics | Rating | Rank | Single Female Poverty |
| Assyrians/Chaldeans/Syriacs | 100.0 /100 | #5 | Exceptional 17.0% |
| Filipinos | 100.0 /100 | #6 | Exceptional 17.0% |
| Thais | 100.0 /100 | #7 | Exceptional 17.3% |
| Immigrants | Iran | 100.0 /100 | #8 | Exceptional 17.5% |
| Bhutanese | 100.0 /100 | #9 | Exceptional 17.7% |
| Immigrants | Ireland | 100.0 /100 | #10 | Exceptional 17.8% |
| Immigrants | Lithuania | 100.0 /100 | #11 | Exceptional 17.8% |
| Immigrants | South Central Asia | 100.0 /100 | #12 | Exceptional 17.8% |
| Immigrants | Bolivia | 100.0 /100 | #13 | Exceptional 17.8% |
| Bolivians | 100.0 /100 | #14 | Exceptional 17.9% |
| Indians (Asian) | 100.0 /100 | #15 | Exceptional 17.9% |
| Iranians | 100.0 /100 | #16 | Exceptional 18.0% |
| Immigrants | Korea | 100.0 /100 | #17 | Exceptional 18.1% |
| Immigrants | Eastern Asia | 100.0 /100 | #18 | Exceptional 18.1% |
| Immigrants | China | 100.0 /100 | #19 | Exceptional 18.1% |
Demographics Similar to Eastern Europeans by Single Female Poverty
In terms of single female poverty, the demographic groups most similar to Eastern Europeans are Immigrants from Fiji (19.1%, a difference of 0.060%), Immigrants from Vietnam (19.1%, a difference of 0.11%), Immigrants from Bulgaria (19.1%, a difference of 0.12%), Argentinean (19.1%, a difference of 0.15%), and Tsimshian (19.1%, a difference of 0.16%).
| Demographics | Rating | Rank | Single Female Poverty |
| Immigrants | Eastern Europe | 99.8 /100 | #50 | Exceptional 19.0% |
| Immigrants | Italy | 99.8 /100 | #51 | Exceptional 19.0% |
| Egyptians | 99.7 /100 | #52 | Exceptional 19.1% |
| Tsimshian | 99.7 /100 | #53 | Exceptional 19.1% |
| Argentineans | 99.7 /100 | #54 | Exceptional 19.1% |
| Immigrants | Vietnam | 99.7 /100 | #55 | Exceptional 19.1% |
| Immigrants | Fiji | 99.7 /100 | #56 | Exceptional 19.1% |
| Eastern Europeans | 99.7 /100 | #57 | Exceptional 19.1% |
| Immigrants | Bulgaria | 99.7 /100 | #58 | Exceptional 19.1% |
| Sri Lankans | 99.6 /100 | #59 | Exceptional 19.2% |
| Russians | 99.6 /100 | #60 | Exceptional 19.2% |
| Cambodians | 99.6 /100 | #61 | Exceptional 19.2% |
| Lithuanians | 99.6 /100 | #62 | Exceptional 19.2% |
| Immigrants | Northern Europe | 99.6 /100 | #63 | Exceptional 19.2% |
| Immigrants | Europe | 99.6 /100 | #64 | Exceptional 19.2% |