Immigrants from Oceania vs Osage Single Female Poverty
COMPARE
Immigrants from Oceania
Osage
Single Female Poverty
Single Female Poverty Comparison
Immigrants from Oceania
Osage
20.7%
SINGLE FEMALE POVERTY
74.3/ 100
METRIC RATING
157th/ 347
METRIC RANK
24.4%
SINGLE FEMALE POVERTY
0.0/ 100
METRIC RATING
291st/ 347
METRIC RANK
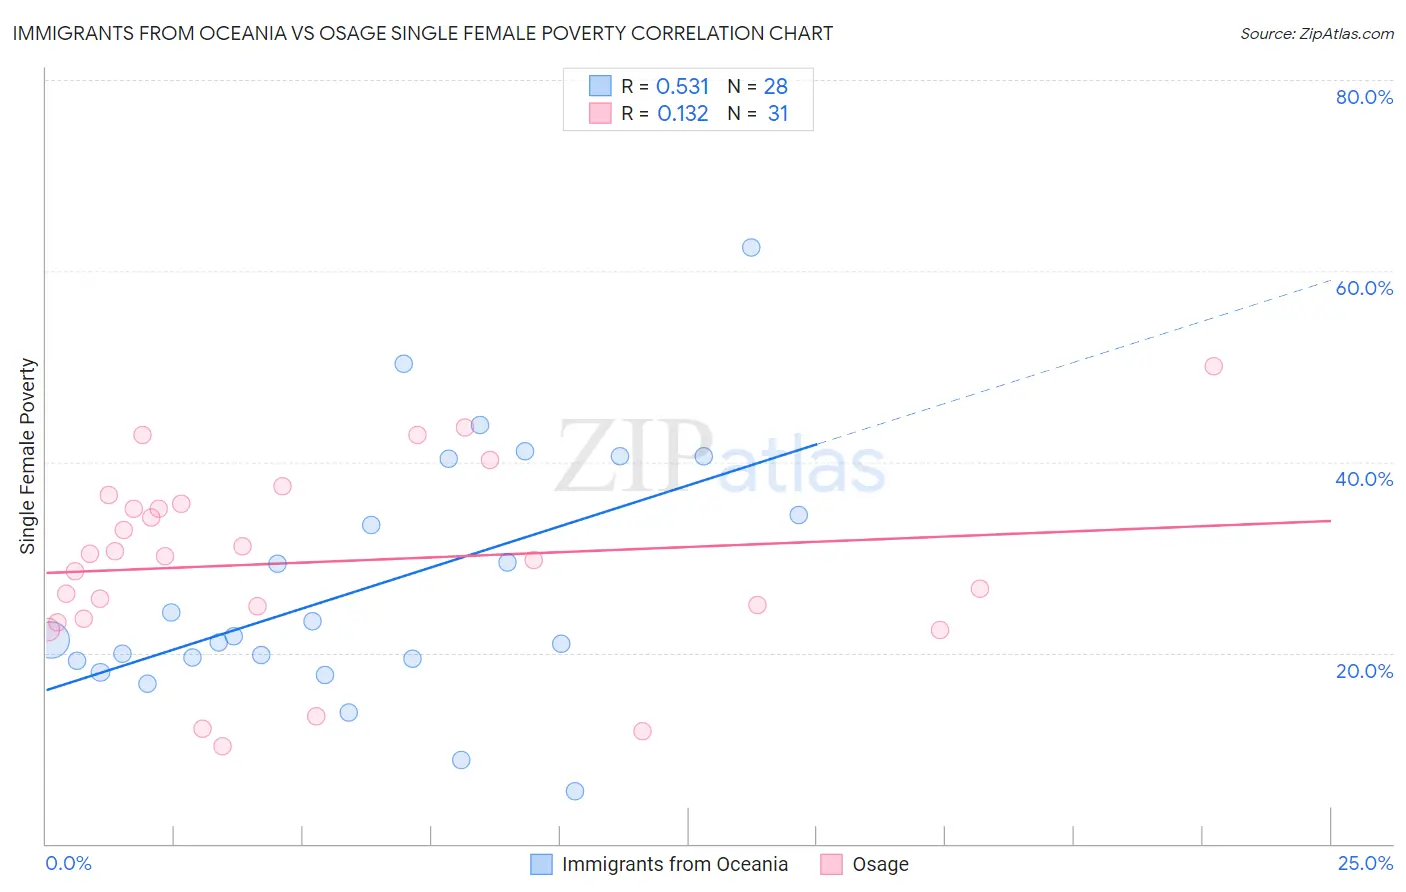
Immigrants from Oceania vs Osage Single Female Poverty Correlation Chart
The statistical analysis conducted on geographies consisting of 301,448,754 people shows a substantial positive correlation between the proportion of Immigrants from Oceania and poverty level among single females in the United States with a correlation coefficient (R) of 0.531 and weighted average of 20.7%. Similarly, the statistical analysis conducted on geographies consisting of 91,495,293 people shows a poor positive correlation between the proportion of Osage and poverty level among single females in the United States with a correlation coefficient (R) of 0.132 and weighted average of 24.4%, a difference of 18.1%.
Single Female Poverty Correlation Summary
| Measurement | Immigrants from Oceania | Osage |
| Minimum | 5.6% | 10.2% |
| Maximum | 62.5% | 50.0% |
| Range | 56.9% | 39.8% |
| Mean | 27.0% | 29.5% |
| Median | 21.6% | 30.1% |
| Interquartile 25% (IQ1) | 19.3% | 23.6% |
| Interquartile 75% (IQ3) | 37.4% | 35.7% |
| Interquartile Range (IQR) | 18.1% | 12.1% |
| Standard Deviation (Sample) | 13.1% | 9.7% |
| Standard Deviation (Population) | 12.8% | 9.6% |
Similar Demographics by Single Female Poverty
Demographics Similar to Immigrants from Oceania by Single Female Poverty
In terms of single female poverty, the demographic groups most similar to Immigrants from Oceania are Danish (20.7%, a difference of 0.11%), South American Indian (20.6%, a difference of 0.12%), Samoan (20.6%, a difference of 0.15%), Costa Rican (20.7%, a difference of 0.20%), and Immigrants from Western Europe (20.6%, a difference of 0.21%).
| Demographics | Rating | Rank | Single Female Poverty |
| Immigrants | Denmark | 80.5 /100 | #150 | Excellent 20.5% |
| Puget Sound Salish | 79.6 /100 | #151 | Good 20.6% |
| Immigrants | Uruguay | 77.7 /100 | #152 | Good 20.6% |
| Swedes | 77.1 /100 | #153 | Good 20.6% |
| Immigrants | Western Europe | 76.7 /100 | #154 | Good 20.6% |
| Samoans | 76.0 /100 | #155 | Good 20.6% |
| South American Indians | 75.7 /100 | #156 | Good 20.6% |
| Immigrants | Oceania | 74.3 /100 | #157 | Good 20.7% |
| Danes | 73.0 /100 | #158 | Good 20.7% |
| Costa Ricans | 71.8 /100 | #159 | Good 20.7% |
| Arabs | 70.8 /100 | #160 | Good 20.7% |
| Kenyans | 68.5 /100 | #161 | Good 20.8% |
| Northern Europeans | 68.4 /100 | #162 | Good 20.8% |
| Lebanese | 67.6 /100 | #163 | Good 20.8% |
| Iraqis | 64.5 /100 | #164 | Good 20.8% |
Demographics Similar to Osage by Single Female Poverty
In terms of single female poverty, the demographic groups most similar to Osage are Alsatian (24.5%, a difference of 0.37%), American (24.5%, a difference of 0.44%), French American Indian (24.6%, a difference of 0.59%), Indonesian (24.3%, a difference of 0.60%), and U.S. Virgin Islander (24.2%, a difference of 0.94%).
| Demographics | Rating | Rank | Single Female Poverty |
| Immigrants | Dominica | 0.0 /100 | #284 | Tragic 23.9% |
| Immigrants | Guatemala | 0.0 /100 | #285 | Tragic 24.1% |
| Cree | 0.0 /100 | #286 | Tragic 24.1% |
| Bangladeshis | 0.0 /100 | #287 | Tragic 24.2% |
| Spanish Americans | 0.0 /100 | #288 | Tragic 24.2% |
| U.S. Virgin Islanders | 0.0 /100 | #289 | Tragic 24.2% |
| Indonesians | 0.0 /100 | #290 | Tragic 24.3% |
| Osage | 0.0 /100 | #291 | Tragic 24.4% |
| Alsatians | 0.0 /100 | #292 | Tragic 24.5% |
| Americans | 0.0 /100 | #293 | Tragic 24.5% |
| French American Indians | 0.0 /100 | #294 | Tragic 24.6% |
| Hispanics or Latinos | 0.0 /100 | #295 | Tragic 24.6% |
| Africans | 0.0 /100 | #296 | Tragic 24.8% |
| Immigrants | Central America | 0.0 /100 | #297 | Tragic 24.8% |
| Yaqui | 0.0 /100 | #298 | Tragic 24.9% |