Immigrants from Honduras vs Osage Single Female Poverty
COMPARE
Immigrants from Honduras
Osage
Single Female Poverty
Single Female Poverty Comparison
Immigrants from Honduras
Osage
25.5%
SINGLE FEMALE POVERTY
0.0/ 100
METRIC RATING
311th/ 347
METRIC RANK
24.4%
SINGLE FEMALE POVERTY
0.0/ 100
METRIC RATING
291st/ 347
METRIC RANK
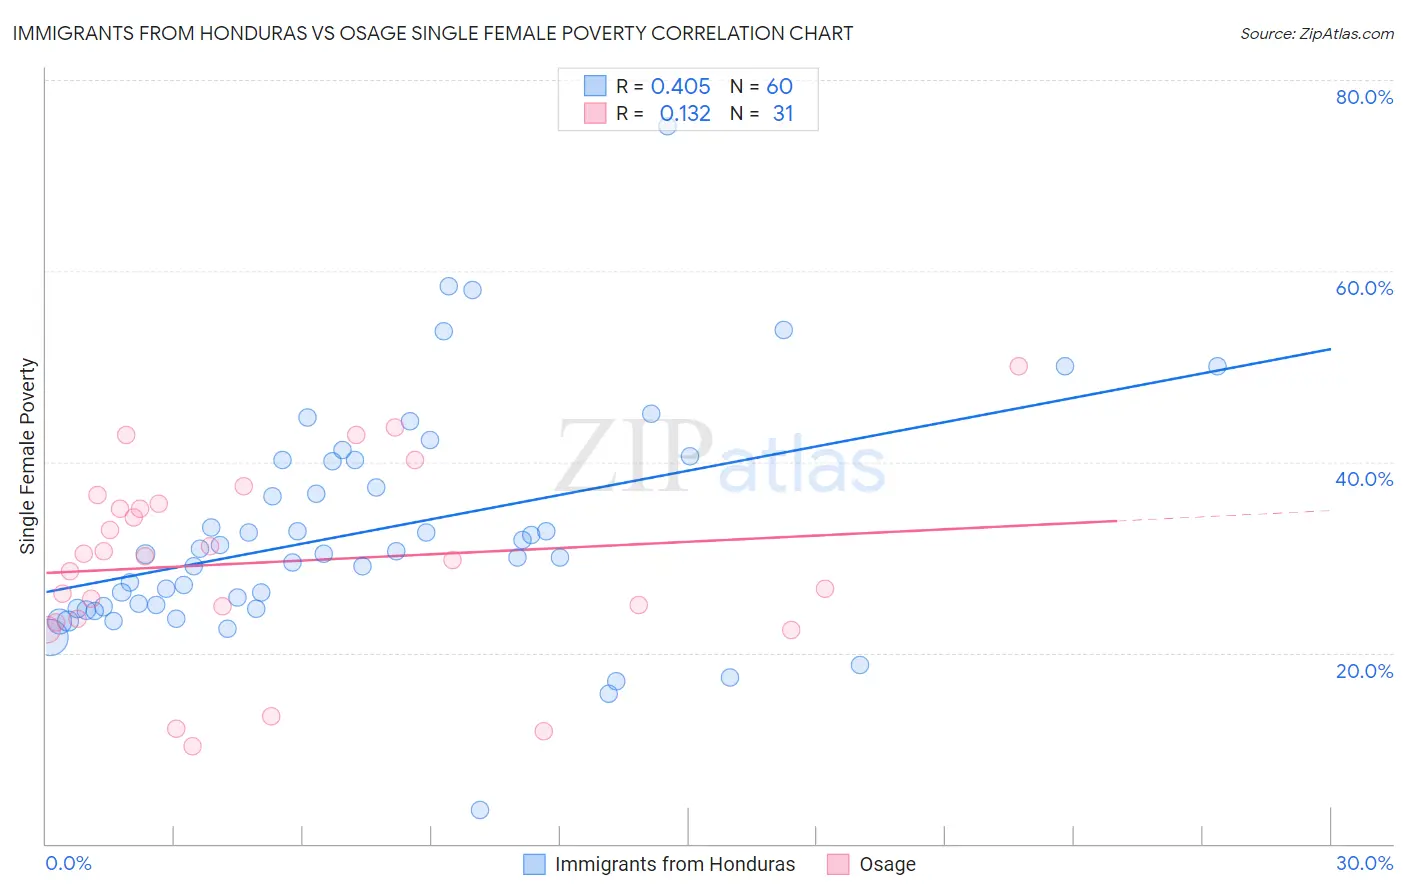
Immigrants from Honduras vs Osage Single Female Poverty Correlation Chart
The statistical analysis conducted on geographies consisting of 320,392,656 people shows a moderate positive correlation between the proportion of Immigrants from Honduras and poverty level among single females in the United States with a correlation coefficient (R) of 0.405 and weighted average of 25.5%. Similarly, the statistical analysis conducted on geographies consisting of 91,495,293 people shows a poor positive correlation between the proportion of Osage and poverty level among single females in the United States with a correlation coefficient (R) of 0.132 and weighted average of 24.4%, a difference of 4.6%.
Single Female Poverty Correlation Summary
| Measurement | Immigrants from Honduras | Osage |
| Minimum | 3.6% | 10.2% |
| Maximum | 75.2% | 50.0% |
| Range | 71.6% | 39.8% |
| Mean | 32.7% | 29.5% |
| Median | 30.4% | 30.1% |
| Interquartile 25% (IQ1) | 24.7% | 23.6% |
| Interquartile 75% (IQ3) | 40.2% | 35.7% |
| Interquartile Range (IQR) | 15.4% | 12.1% |
| Standard Deviation (Sample) | 12.1% | 9.7% |
| Standard Deviation (Population) | 12.0% | 9.6% |
Demographics Similar to Immigrants from Honduras and Osage by Single Female Poverty
In terms of single female poverty, the demographic groups most similar to Immigrants from Honduras are Central American Indian (25.5%, a difference of 0.28%), Dominican (25.4%, a difference of 0.43%), Aleut (25.4%, a difference of 0.44%), Potawatomi (25.4%, a difference of 0.61%), and Immigrants from Mexico (25.3%, a difference of 0.84%). Similarly, the demographic groups most similar to Osage are Alsatian (24.5%, a difference of 0.37%), American (24.5%, a difference of 0.44%), French American Indian (24.6%, a difference of 0.59%), Hispanic or Latino (24.6%, a difference of 0.94%), and African (24.8%, a difference of 1.4%).
| Demographics | Rating | Rank | Single Female Poverty |
| Osage | 0.0 /100 | #291 | Tragic 24.4% |
| Alsatians | 0.0 /100 | #292 | Tragic 24.5% |
| Americans | 0.0 /100 | #293 | Tragic 24.5% |
| French American Indians | 0.0 /100 | #294 | Tragic 24.6% |
| Hispanics or Latinos | 0.0 /100 | #295 | Tragic 24.6% |
| Africans | 0.0 /100 | #296 | Tragic 24.8% |
| Immigrants | Central America | 0.0 /100 | #297 | Tragic 24.8% |
| Yaqui | 0.0 /100 | #298 | Tragic 24.9% |
| Mexicans | 0.0 /100 | #299 | Tragic 25.0% |
| Blackfeet | 0.0 /100 | #300 | Tragic 25.1% |
| Hondurans | 0.0 /100 | #301 | Tragic 25.1% |
| Shoshone | 0.0 /100 | #302 | Tragic 25.1% |
| Somalis | 0.0 /100 | #303 | Tragic 25.2% |
| Immigrants | Congo | 0.0 /100 | #304 | Tragic 25.3% |
| Immigrants | Dominican Republic | 0.0 /100 | #305 | Tragic 25.3% |
| Immigrants | Mexico | 0.0 /100 | #306 | Tragic 25.3% |
| Potawatomi | 0.0 /100 | #307 | Tragic 25.4% |
| Aleuts | 0.0 /100 | #308 | Tragic 25.4% |
| Dominicans | 0.0 /100 | #309 | Tragic 25.4% |
| Central American Indians | 0.0 /100 | #310 | Tragic 25.5% |
| Immigrants | Honduras | 0.0 /100 | #311 | Tragic 25.5% |