Paiute vs Osage Median Earnings
COMPARE
Paiute
Osage
Median Earnings
Median Earnings Comparison
Paiute
Osage
$41,508
MEDIAN EARNINGS
0.1/ 100
METRIC RATING
290th/ 347
METRIC RANK
$42,651
MEDIAN EARNINGS
0.5/ 100
METRIC RATING
270th/ 347
METRIC RANK
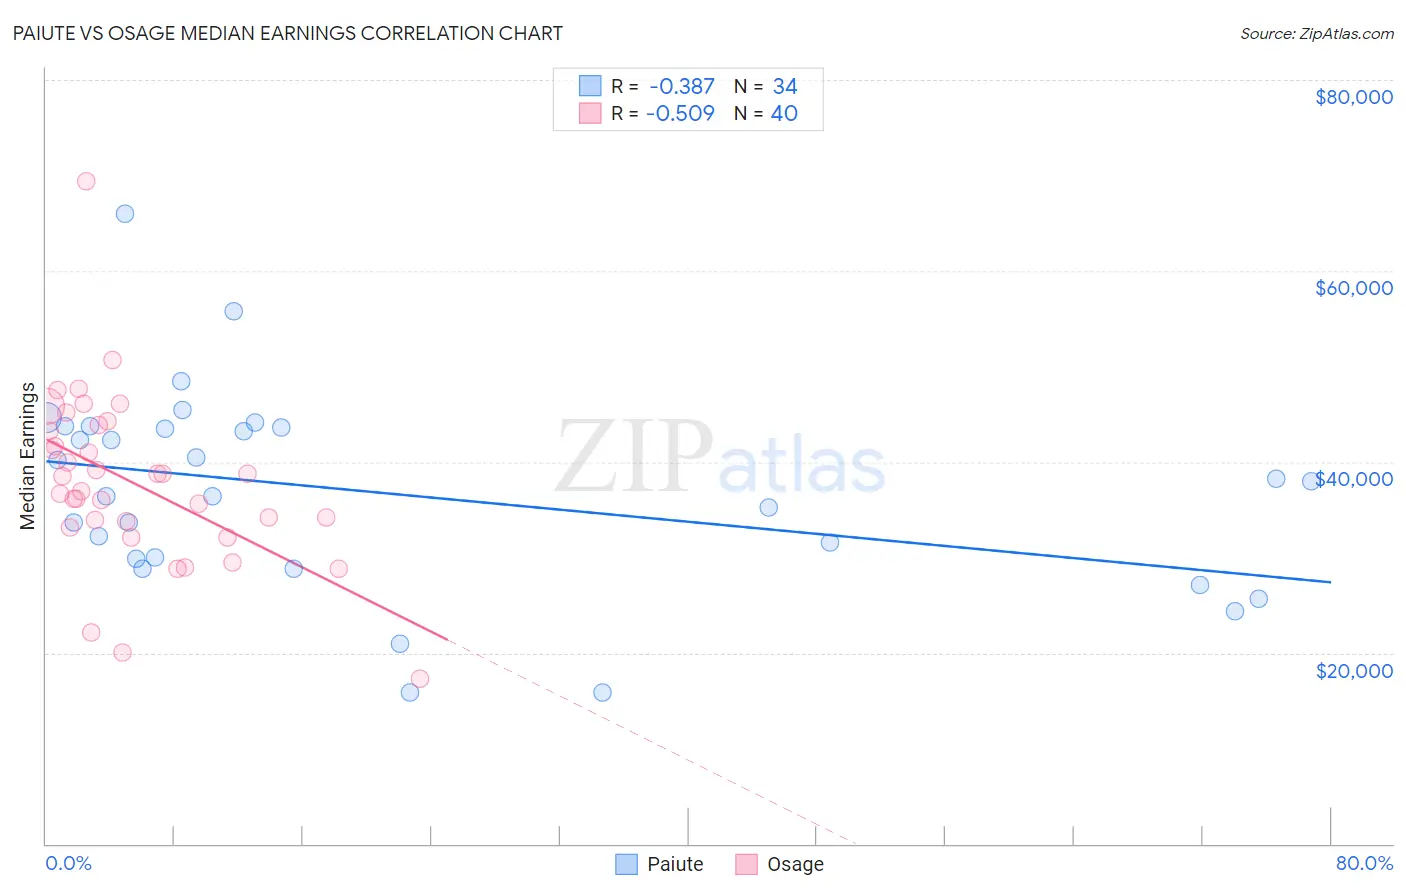
Paiute vs Osage Median Earnings Correlation Chart
The statistical analysis conducted on geographies consisting of 58,401,249 people shows a mild negative correlation between the proportion of Paiute and median earnings in the United States with a correlation coefficient (R) of -0.387 and weighted average of $41,508. Similarly, the statistical analysis conducted on geographies consisting of 91,804,179 people shows a substantial negative correlation between the proportion of Osage and median earnings in the United States with a correlation coefficient (R) of -0.509 and weighted average of $42,651, a difference of 2.8%.
Median Earnings Correlation Summary
| Measurement | Paiute | Osage |
| Minimum | $15,859 | $17,308 |
| Maximum | $65,957 | $69,422 |
| Range | $50,098 | $52,114 |
| Mean | $36,753 | $37,848 |
| Median | $37,218 | $37,712 |
| Interquartile 25% (IQ1) | $29,813 | $33,454 |
| Interquartile 75% (IQ3) | $43,606 | $43,538 |
| Interquartile Range (IQR) | $13,793 | $10,084 |
| Standard Deviation (Sample) | $10,514 | $9,089 |
| Standard Deviation (Population) | $10,358 | $8,975 |
Demographics Similar to Paiute and Osage by Median Earnings
In terms of median earnings, the demographic groups most similar to Paiute are Comanche ($41,519, a difference of 0.030%), Immigrants from Dominican Republic ($41,554, a difference of 0.11%), Indonesian ($41,701, a difference of 0.46%), Mexican American Indian ($41,719, a difference of 0.51%), and Immigrants from Nicaragua ($41,737, a difference of 0.55%). Similarly, the demographic groups most similar to Osage are Pennsylvania German ($42,615, a difference of 0.090%), Iroquois ($42,430, a difference of 0.52%), Immigrants from Dominica ($42,420, a difference of 0.55%), Immigrants from El Salvador ($42,413, a difference of 0.56%), and Immigrants from Belize ($42,339, a difference of 0.74%).
| Demographics | Rating | Rank | Median Earnings |
| Osage | 0.5 /100 | #270 | Tragic $42,651 |
| Pennsylvania Germans | 0.5 /100 | #271 | Tragic $42,615 |
| Iroquois | 0.4 /100 | #272 | Tragic $42,430 |
| Immigrants | Dominica | 0.4 /100 | #273 | Tragic $42,420 |
| Immigrants | El Salvador | 0.4 /100 | #274 | Tragic $42,413 |
| Immigrants | Belize | 0.3 /100 | #275 | Tragic $42,339 |
| Spanish Americans | 0.3 /100 | #276 | Tragic $42,316 |
| Central Americans | 0.3 /100 | #277 | Tragic $42,280 |
| Cajuns | 0.3 /100 | #278 | Tragic $42,189 |
| Colville | 0.2 /100 | #279 | Tragic $42,151 |
| Hmong | 0.2 /100 | #280 | Tragic $42,111 |
| Marshallese | 0.2 /100 | #281 | Tragic $41,969 |
| Africans | 0.2 /100 | #282 | Tragic $41,955 |
| Dominicans | 0.2 /100 | #283 | Tragic $41,864 |
| Blackfeet | 0.2 /100 | #284 | Tragic $41,822 |
| Immigrants | Nicaragua | 0.1 /100 | #285 | Tragic $41,737 |
| Mexican American Indians | 0.1 /100 | #286 | Tragic $41,719 |
| Indonesians | 0.1 /100 | #287 | Tragic $41,701 |
| Immigrants | Dominican Republic | 0.1 /100 | #288 | Tragic $41,554 |
| Comanche | 0.1 /100 | #289 | Tragic $41,519 |
| Paiute | 0.1 /100 | #290 | Tragic $41,508 |