Native/Alaskan vs Osage Single Female Poverty
COMPARE
Native/Alaskan
Osage
Single Female Poverty
Single Female Poverty Comparison
Natives/Alaskans
Osage
28.2%
SINGLE FEMALE POVERTY
0.0/ 100
METRIC RATING
331st/ 347
METRIC RANK
24.4%
SINGLE FEMALE POVERTY
0.0/ 100
METRIC RATING
291st/ 347
METRIC RANK
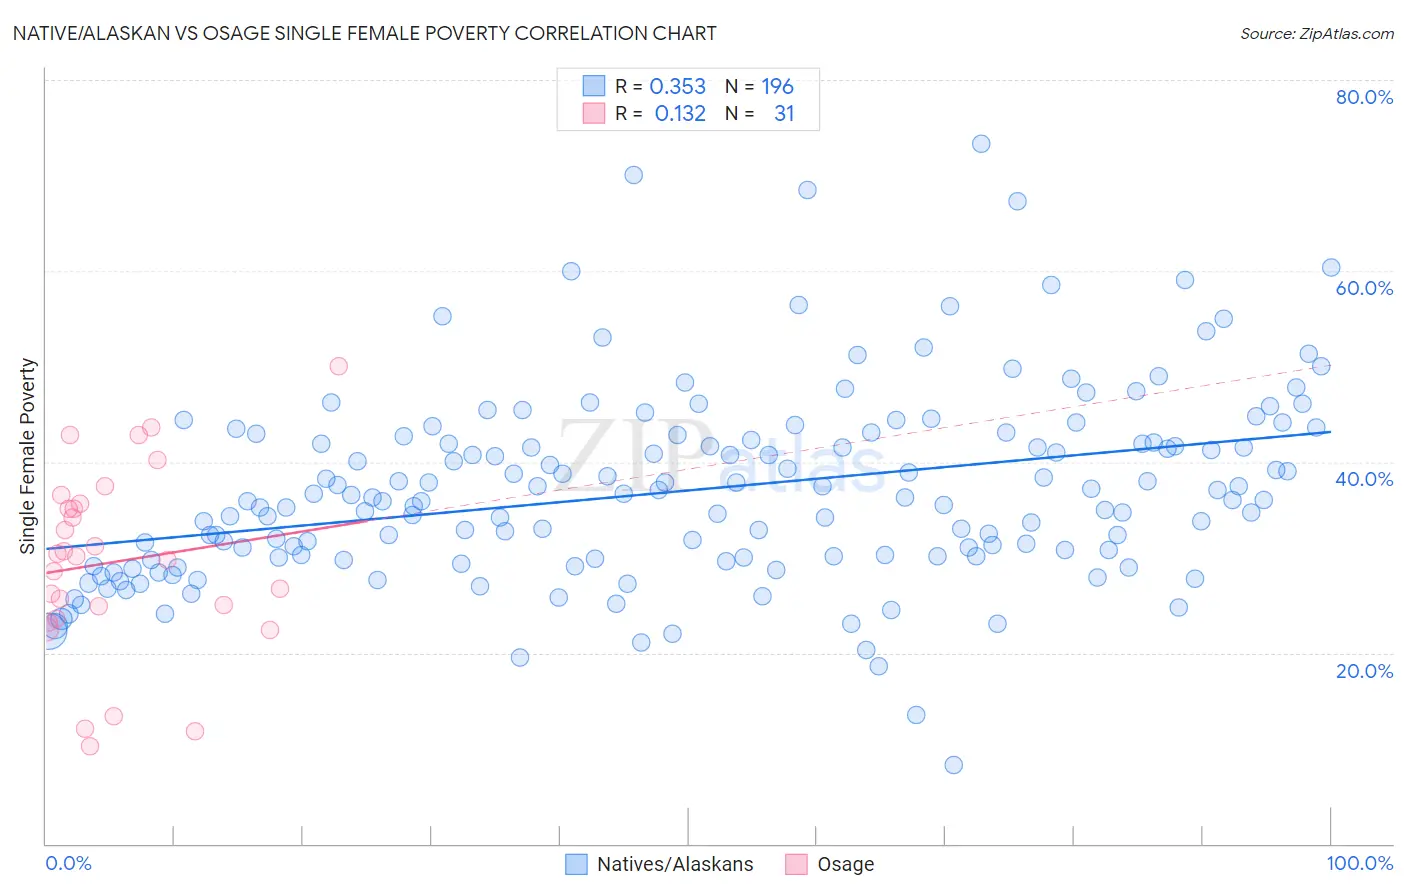
Native/Alaskan vs Osage Single Female Poverty Correlation Chart
The statistical analysis conducted on geographies consisting of 503,027,149 people shows a mild positive correlation between the proportion of Natives/Alaskans and poverty level among single females in the United States with a correlation coefficient (R) of 0.353 and weighted average of 28.2%. Similarly, the statistical analysis conducted on geographies consisting of 91,495,293 people shows a poor positive correlation between the proportion of Osage and poverty level among single females in the United States with a correlation coefficient (R) of 0.132 and weighted average of 24.4%, a difference of 15.6%.
Single Female Poverty Correlation Summary
| Measurement | Native/Alaskan | Osage |
| Minimum | 8.3% | 10.2% |
| Maximum | 73.3% | 50.0% |
| Range | 65.1% | 39.8% |
| Mean | 37.0% | 29.5% |
| Median | 36.0% | 30.1% |
| Interquartile 25% (IQ1) | 30.0% | 23.6% |
| Interquartile 75% (IQ3) | 42.5% | 35.7% |
| Interquartile Range (IQR) | 12.5% | 12.1% |
| Standard Deviation (Sample) | 10.1% | 9.7% |
| Standard Deviation (Population) | 10.1% | 9.6% |
Similar Demographics by Single Female Poverty
Demographics Similar to Natives/Alaskans by Single Female Poverty
In terms of single female poverty, the demographic groups most similar to Natives/Alaskans are Yakama (28.3%, a difference of 0.26%), Hopi (28.0%, a difference of 0.64%), Ute (28.4%, a difference of 0.68%), Menominee (27.8%, a difference of 1.3%), and Pueblo (28.6%, a difference of 1.4%).
| Demographics | Rating | Rank | Single Female Poverty |
| Kiowa | 0.0 /100 | #324 | Tragic 26.9% |
| Choctaw | 0.0 /100 | #325 | Tragic 27.2% |
| Creek | 0.0 /100 | #326 | Tragic 27.4% |
| Dutch West Indians | 0.0 /100 | #327 | Tragic 27.5% |
| Apache | 0.0 /100 | #328 | Tragic 27.7% |
| Menominee | 0.0 /100 | #329 | Tragic 27.8% |
| Hopi | 0.0 /100 | #330 | Tragic 28.0% |
| Natives/Alaskans | 0.0 /100 | #331 | Tragic 28.2% |
| Yakama | 0.0 /100 | #332 | Tragic 28.3% |
| Ute | 0.0 /100 | #333 | Tragic 28.4% |
| Pueblo | 0.0 /100 | #334 | Tragic 28.6% |
| Immigrants | Yemen | 0.0 /100 | #335 | Tragic 28.9% |
| Colville | 0.0 /100 | #336 | Tragic 29.1% |
| Yuman | 0.0 /100 | #337 | Tragic 29.4% |
| Pima | 0.0 /100 | #338 | Tragic 30.3% |
Demographics Similar to Osage by Single Female Poverty
In terms of single female poverty, the demographic groups most similar to Osage are Alsatian (24.5%, a difference of 0.37%), American (24.5%, a difference of 0.44%), French American Indian (24.6%, a difference of 0.59%), Indonesian (24.3%, a difference of 0.60%), and U.S. Virgin Islander (24.2%, a difference of 0.94%).
| Demographics | Rating | Rank | Single Female Poverty |
| Immigrants | Dominica | 0.0 /100 | #284 | Tragic 23.9% |
| Immigrants | Guatemala | 0.0 /100 | #285 | Tragic 24.1% |
| Cree | 0.0 /100 | #286 | Tragic 24.1% |
| Bangladeshis | 0.0 /100 | #287 | Tragic 24.2% |
| Spanish Americans | 0.0 /100 | #288 | Tragic 24.2% |
| U.S. Virgin Islanders | 0.0 /100 | #289 | Tragic 24.2% |
| Indonesians | 0.0 /100 | #290 | Tragic 24.3% |
| Osage | 0.0 /100 | #291 | Tragic 24.4% |
| Alsatians | 0.0 /100 | #292 | Tragic 24.5% |
| Americans | 0.0 /100 | #293 | Tragic 24.5% |
| French American Indians | 0.0 /100 | #294 | Tragic 24.6% |
| Hispanics or Latinos | 0.0 /100 | #295 | Tragic 24.6% |
| Africans | 0.0 /100 | #296 | Tragic 24.8% |
| Immigrants | Central America | 0.0 /100 | #297 | Tragic 24.8% |
| Yaqui | 0.0 /100 | #298 | Tragic 24.9% |