Nicaraguan vs Osage Single Female Poverty
COMPARE
Nicaraguan
Osage
Single Female Poverty
Single Female Poverty Comparison
Nicaraguans
Osage
21.3%
SINGLE FEMALE POVERTY
27.6/ 100
METRIC RATING
195th/ 347
METRIC RANK
24.4%
SINGLE FEMALE POVERTY
0.0/ 100
METRIC RATING
291st/ 347
METRIC RANK
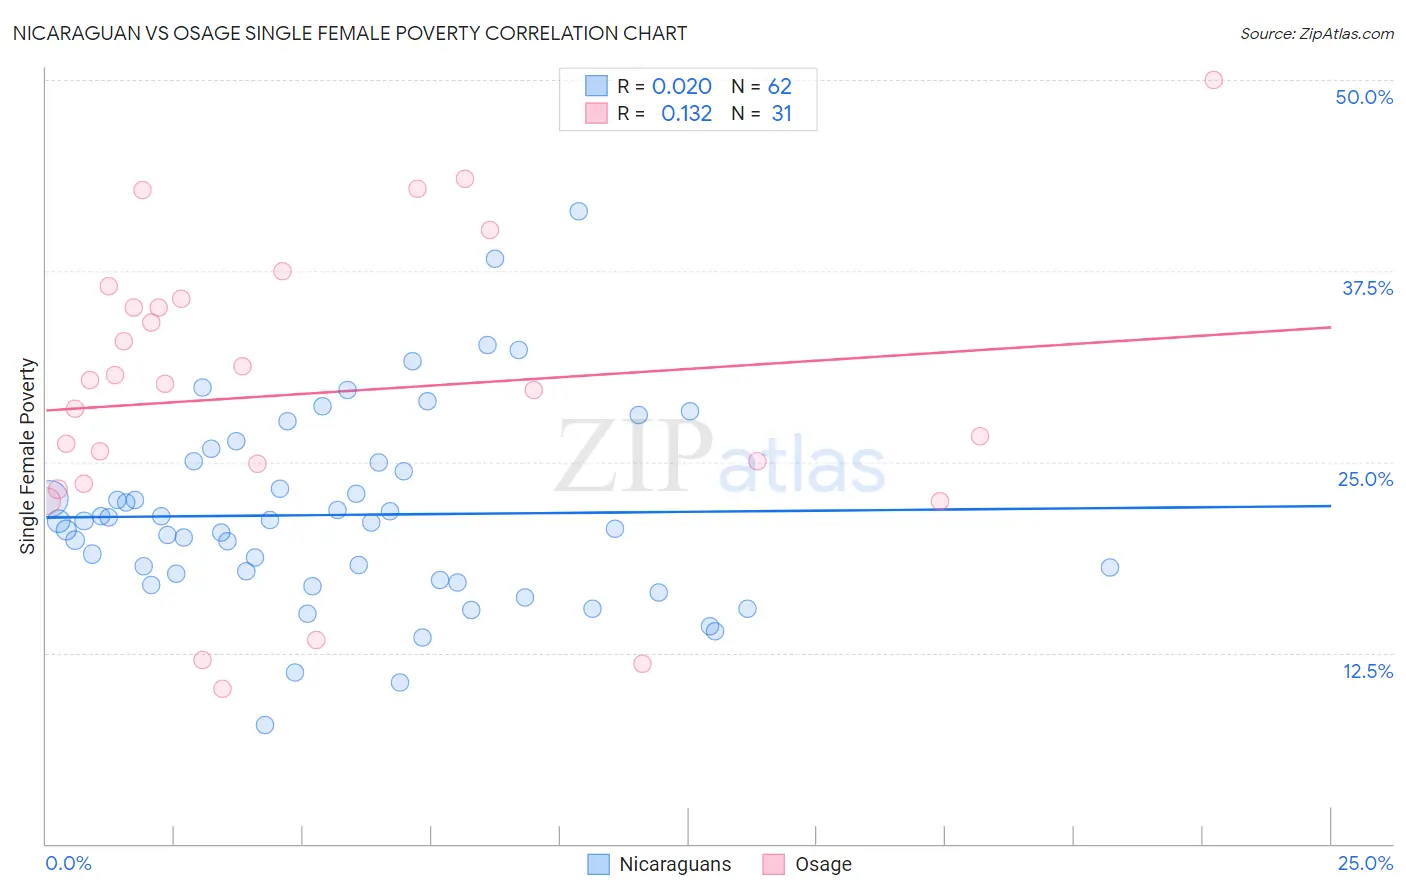
Nicaraguan vs Osage Single Female Poverty Correlation Chart
The statistical analysis conducted on geographies consisting of 283,867,505 people shows no correlation between the proportion of Nicaraguans and poverty level among single females in the United States with a correlation coefficient (R) of 0.020 and weighted average of 21.3%. Similarly, the statistical analysis conducted on geographies consisting of 91,495,293 people shows a poor positive correlation between the proportion of Osage and poverty level among single females in the United States with a correlation coefficient (R) of 0.132 and weighted average of 24.4%, a difference of 14.4%.
Single Female Poverty Correlation Summary
| Measurement | Nicaraguan | Osage |
| Minimum | 7.8% | 10.2% |
| Maximum | 41.4% | 50.0% |
| Range | 33.6% | 39.8% |
| Mean | 21.5% | 29.5% |
| Median | 21.1% | 30.1% |
| Interquartile 25% (IQ1) | 17.2% | 23.6% |
| Interquartile 75% (IQ3) | 24.9% | 35.7% |
| Interquartile Range (IQR) | 7.7% | 12.1% |
| Standard Deviation (Sample) | 6.3% | 9.7% |
| Standard Deviation (Population) | 6.3% | 9.6% |
Similar Demographics by Single Female Poverty
Demographics Similar to Nicaraguans by Single Female Poverty
In terms of single female poverty, the demographic groups most similar to Nicaraguans are Czechoslovakian (21.3%, a difference of 0.010%), Basque (21.3%, a difference of 0.040%), Immigrants from Saudi Arabia (21.3%, a difference of 0.040%), Japanese (21.3%, a difference of 0.090%), and Immigrants from Jamaica (21.3%, a difference of 0.22%).
| Demographics | Rating | Rank | Single Female Poverty |
| Yugoslavians | 35.4 /100 | #188 | Fair 21.2% |
| Immigrants | Cuba | 35.3 /100 | #189 | Fair 21.2% |
| Trinidadians and Tobagonians | 35.2 /100 | #190 | Fair 21.2% |
| Immigrants | Germany | 31.1 /100 | #191 | Fair 21.3% |
| Immigrants | Jamaica | 30.5 /100 | #192 | Fair 21.3% |
| Basques | 28.1 /100 | #193 | Fair 21.3% |
| Czechoslovakians | 27.7 /100 | #194 | Fair 21.3% |
| Nicaraguans | 27.6 /100 | #195 | Fair 21.3% |
| Immigrants | Saudi Arabia | 27.1 /100 | #196 | Fair 21.3% |
| Japanese | 26.4 /100 | #197 | Fair 21.3% |
| Swiss | 24.2 /100 | #198 | Fair 21.4% |
| Immigrants | Immigrants | 22.0 /100 | #199 | Fair 21.4% |
| Irish | 21.4 /100 | #200 | Fair 21.4% |
| Nigerians | 20.9 /100 | #201 | Fair 21.4% |
| Immigrants | Kenya | 20.7 /100 | #202 | Fair 21.4% |
Demographics Similar to Osage by Single Female Poverty
In terms of single female poverty, the demographic groups most similar to Osage are Alsatian (24.5%, a difference of 0.37%), American (24.5%, a difference of 0.44%), French American Indian (24.6%, a difference of 0.59%), Indonesian (24.3%, a difference of 0.60%), and U.S. Virgin Islander (24.2%, a difference of 0.94%).
| Demographics | Rating | Rank | Single Female Poverty |
| Immigrants | Dominica | 0.0 /100 | #284 | Tragic 23.9% |
| Immigrants | Guatemala | 0.0 /100 | #285 | Tragic 24.1% |
| Cree | 0.0 /100 | #286 | Tragic 24.1% |
| Bangladeshis | 0.0 /100 | #287 | Tragic 24.2% |
| Spanish Americans | 0.0 /100 | #288 | Tragic 24.2% |
| U.S. Virgin Islanders | 0.0 /100 | #289 | Tragic 24.2% |
| Indonesians | 0.0 /100 | #290 | Tragic 24.3% |
| Osage | 0.0 /100 | #291 | Tragic 24.4% |
| Alsatians | 0.0 /100 | #292 | Tragic 24.5% |
| Americans | 0.0 /100 | #293 | Tragic 24.5% |
| French American Indians | 0.0 /100 | #294 | Tragic 24.6% |
| Hispanics or Latinos | 0.0 /100 | #295 | Tragic 24.6% |
| Africans | 0.0 /100 | #296 | Tragic 24.8% |
| Immigrants | Central America | 0.0 /100 | #297 | Tragic 24.8% |
| Yaqui | 0.0 /100 | #298 | Tragic 24.9% |