Iranian vs Immigrants from Singapore Single Female Poverty
COMPARE
Iranian
Immigrants from Singapore
Single Female Poverty
Single Female Poverty Comparison
Iranians
Immigrants from Singapore
18.0%
SINGLE FEMALE POVERTY
100.0/ 100
METRIC RATING
16th/ 347
METRIC RANK
18.3%
SINGLE FEMALE POVERTY
100.0/ 100
METRIC RATING
25th/ 347
METRIC RANK
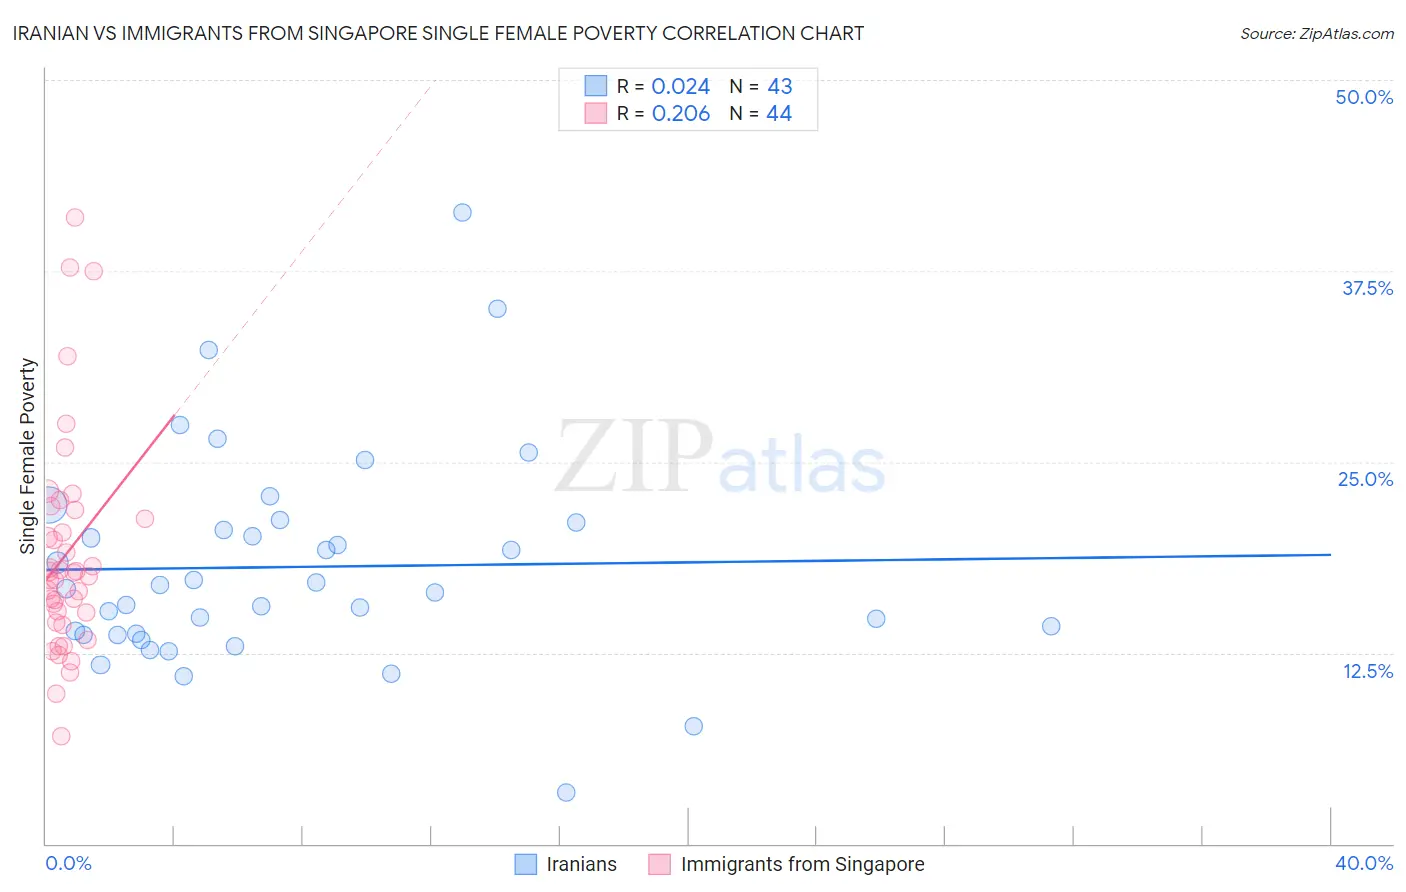
Iranian vs Immigrants from Singapore Single Female Poverty Correlation Chart
The statistical analysis conducted on geographies consisting of 312,309,917 people shows no correlation between the proportion of Iranians and poverty level among single females in the United States with a correlation coefficient (R) of 0.024 and weighted average of 18.0%. Similarly, the statistical analysis conducted on geographies consisting of 136,295,396 people shows a weak positive correlation between the proportion of Immigrants from Singapore and poverty level among single females in the United States with a correlation coefficient (R) of 0.206 and weighted average of 18.3%, a difference of 2.0%.
Single Female Poverty Correlation Summary
| Measurement | Iranian | Immigrants from Singapore |
| Minimum | 3.3% | 7.1% |
| Maximum | 41.3% | 41.0% |
| Range | 38.0% | 33.9% |
| Mean | 18.1% | 19.0% |
| Median | 16.7% | 17.7% |
| Interquartile 25% (IQ1) | 13.7% | 14.8% |
| Interquartile 75% (IQ3) | 21.1% | 21.6% |
| Interquartile Range (IQR) | 7.4% | 6.8% |
| Standard Deviation (Sample) | 7.1% | 7.2% |
| Standard Deviation (Population) | 7.0% | 7.1% |
Demographics Similar to Iranians and Immigrants from Singapore by Single Female Poverty
In terms of single female poverty, the demographic groups most similar to Iranians are Indian (Asian) (17.9%, a difference of 0.16%), Bolivian (17.9%, a difference of 0.30%), Immigrants from Korea (18.1%, a difference of 0.60%), Immigrants from Bolivia (17.8%, a difference of 0.75%), and Immigrants from Eastern Asia (18.1%, a difference of 0.88%). Similarly, the demographic groups most similar to Immigrants from Singapore are Immigrants from Israel (18.3%, a difference of 0.020%), Armenian (18.3%, a difference of 0.10%), Burmese (18.3%, a difference of 0.33%), Asian (18.3%, a difference of 0.33%), and Maltese (18.3%, a difference of 0.34%).
| Demographics | Rating | Rank | Single Female Poverty |
| Immigrants | Ireland | 100.0 /100 | #10 | Exceptional 17.8% |
| Immigrants | Lithuania | 100.0 /100 | #11 | Exceptional 17.8% |
| Immigrants | South Central Asia | 100.0 /100 | #12 | Exceptional 17.8% |
| Immigrants | Bolivia | 100.0 /100 | #13 | Exceptional 17.8% |
| Bolivians | 100.0 /100 | #14 | Exceptional 17.9% |
| Indians (Asian) | 100.0 /100 | #15 | Exceptional 17.9% |
| Iranians | 100.0 /100 | #16 | Exceptional 18.0% |
| Immigrants | Korea | 100.0 /100 | #17 | Exceptional 18.1% |
| Immigrants | Eastern Asia | 100.0 /100 | #18 | Exceptional 18.1% |
| Immigrants | China | 100.0 /100 | #19 | Exceptional 18.1% |
| Immigrants | Greece | 100.0 /100 | #20 | Exceptional 18.3% |
| Maltese | 100.0 /100 | #21 | Exceptional 18.3% |
| Burmese | 100.0 /100 | #22 | Exceptional 18.3% |
| Asians | 100.0 /100 | #23 | Exceptional 18.3% |
| Armenians | 100.0 /100 | #24 | Exceptional 18.3% |
| Immigrants | Singapore | 100.0 /100 | #25 | Exceptional 18.3% |
| Immigrants | Israel | 100.0 /100 | #26 | Exceptional 18.3% |
| Immigrants | Pakistan | 100.0 /100 | #27 | Exceptional 18.4% |
| Immigrants | Moldova | 100.0 /100 | #28 | Exceptional 18.5% |
| Immigrants | Poland | 100.0 /100 | #29 | Exceptional 18.5% |
| Immigrants | North Macedonia | 99.9 /100 | #30 | Exceptional 18.5% |