Dutch vs Immigrants from Singapore Single Female Poverty

COMPARE

Dutch
Race
Ancestry
AfghanAfricanAlaska NativeAlaskan AthabascanAlbanianAleutAlsatianAmericanApacheArabArapahoArgentineanArmenianAssyrian/Chaldean/SyriacAustralianAustrianBahamianBangladeshiBarbadianBasqueBelgianBelizeanBermudanBhutaneseBlackfeetBolivianBrazilianBritishBritish West IndianBulgarianBurmeseCajunCambodianCanadianCape VerdeanCarpatho RusynCelticCentral AmericanCentral American IndianCherokeeCheyenneChickasawChileanChineseChippewaChoctawColombianColvilleComancheCosta RicanCreeCreekCroatianCrowCubanCypriotCzechCzechoslovakianDanishDelawareDominicanDutchDutch West IndianEastern EuropeanEcuadorianEgyptianEnglishEstonianEthiopianEuropeanFijianFilipinoFinnishFrenchFrench American IndianFrench CanadianGermanGerman RussianGhanaianGreekGuamanian/ChamorroGuatemalanGuyaneseHaitianHmongHonduranHopiHoumaHungarianIcelanderIndian (Asian)IndonesianInupiatIranianIraqiIrishIroquoisIsraeliItalianJamaicanJapaneseJordanianKenyanKiowaKoreanLaotianLatvianLebaneseLiberianLithuanianLumbeeLuxembourgerMacedonianMalaysianMalteseMarshalleseMenomineeMexicanMexican American IndianMongolianMoroccanNative HawaiianNavajoNepaleseNew ZealanderNicaraguanNigerianNorthern EuropeanNorwegianOkinawanOsageOttawaPaiutePakistaniPalestinianPanamanianParaguayanPennsylvania GermanPeruvianPimaPolishPortuguesePotawatomiPuebloPuerto RicanPuget Sound SalishRomanianRussianSalvadoranSamoanScandinavianScotch-IrishScottishSeminoleSenegaleseSerbianShoshoneSierra LeoneanSiouxSlavicSlovakSloveneSomaliSouth AfricanSouth AmericanSouth American IndianSoviet UnionSpaniardSpanishSpanish AmericanSpanish American IndianSri LankanSubsaharan AfricanSudaneseSwedishSwissSyrianTaiwaneseThaiTlingit-HaidaTohono O'OdhamTonganTrinidadian and TobagonianTsimshianTurkishU.S. Virgin IslanderUgandanUkrainianUruguayanUteVenezuelanVietnameseWelshWest IndianYakamaYaquiYugoslavianYumanYup'ikZimbabwean
Immigration
NonimmigrantsImmigrantsAfghanistanAfricaAlbaniaArgentinaArmeniaAsiaAustraliaAustriaBahamasBangladeshBarbadosBelarusBelgiumBelizeBoliviaBosnia and HerzegovinaBrazilBulgariaBurma/MyanmarCabo VerdeCambodiaCameroonCanadaCaribbeanCentral AmericaChileChinaColombiaCongoCosta RicaCroatiaCubaCzechoslovakiaDenmarkDominicaDominican RepublicEastern AfricaEastern AsiaEastern EuropeEcuadorEgyptEl SalvadorEnglandEritreaEthiopiaEuropeFijiFranceGermanyGhanaGreeceGrenadaGuatemalaGuyanaHaitiHondurasHong KongHungaryIndiaIndonesiaIranIraqIrelandIsraelItalyJamaicaJapanJordanKazakhstanKenyaKoreaKuwaitLaosLatin AmericaLatviaLebanonLiberiaLithuaniaMalaysiaMexicoMicronesiaMiddle AfricaMoldovaMoroccoNepalNetherlandsNicaraguaNigeriaNorth AmericaNorth MacedoniaNorthern AfricaNorthern EuropeNorwayOceaniaPakistanPanamaPeruPhilippinesPolandPortugalRomaniaRussiaSaudi ArabiaScotlandSenegalSerbiaSierra LeoneSomaliaSouth AfricaSouth AmericaSouth Central AsiaSouth Eastern AsiaSouthern EuropeSpainSri LankaSt. Vincent and the GrenadinesSudanSwedenSwitzerlandSyriaTaiwanThailandTrinidad and TobagoTurkeyUgandaUkraineUruguayUzbekistanVenezuelaVietnamWest IndiesWestern AfricaWestern AsiaWestern EuropeYemenZaireZimbabweAzores
Immigrants from Singapore
Race
Ancestry
AfghanAfricanAlaska NativeAlaskan AthabascanAlbanianAleutAlsatianAmericanApacheArabArapahoArgentineanArmenianAssyrian/Chaldean/SyriacAustralianAustrianBahamianBangladeshiBarbadianBasqueBelgianBelizeanBermudanBhutaneseBlackfeetBolivianBrazilianBritishBritish West IndianBulgarianBurmeseCajunCambodianCanadianCape VerdeanCarpatho RusynCelticCentral AmericanCentral American IndianCherokeeCheyenneChickasawChileanChineseChippewaChoctawColombianColvilleComancheCosta RicanCreeCreekCroatianCrowCubanCypriotCzechCzechoslovakianDanishDelawareDominicanDutch West IndianEastern EuropeanEcuadorianEgyptianEnglishEstonianEthiopianEuropeanFijianFilipinoFinnishFrenchFrench American IndianFrench CanadianGermanGerman RussianGhanaianGreekGuamanian/ChamorroGuatemalanGuyaneseHaitianHmongHonduranHopiHoumaHungarianIcelanderIndian (Asian)IndonesianInupiatIranianIraqiIrishIroquoisIsraeliItalianJamaicanJapaneseJordanianKenyanKiowaKoreanLaotianLatvianLebaneseLiberianLithuanianLumbeeLuxembourgerMacedonianMalaysianMalteseMarshalleseMenomineeMexicanMexican American IndianMongolianMoroccanNative HawaiianNavajoNepaleseNew ZealanderNicaraguanNigerianNorthern EuropeanNorwegianOkinawanOsageOttawaPaiutePakistaniPalestinianPanamanianParaguayanPennsylvania GermanPeruvianPimaPolishPortuguesePotawatomiPuebloPuerto RicanPuget Sound SalishRomanianRussianSalvadoranSamoanScandinavianScotch-IrishScottishSeminoleSenegaleseSerbianShoshoneSierra LeoneanSiouxSlavicSlovakSloveneSomaliSouth AfricanSouth AmericanSouth American IndianSoviet UnionSpaniardSpanishSpanish AmericanSpanish American IndianSri LankanSubsaharan AfricanSudaneseSwedishSwissSyrianTaiwaneseThaiTlingit-HaidaTohono O'OdhamTonganTrinidadian and TobagonianTsimshianTurkishU.S. Virgin IslanderUgandanUkrainianUruguayanUteVenezuelanVietnameseWelshWest IndianYakamaYaquiYugoslavianYumanYup'ikZimbabwean
Immigration
NonimmigrantsImmigrantsAfghanistanAfricaAlbaniaArgentinaArmeniaAsiaAustraliaAustriaBahamasBangladeshBarbadosBelarusBelgiumBelizeBoliviaBosnia and HerzegovinaBrazilBulgariaBurma/MyanmarCabo VerdeCambodiaCameroonCanadaCaribbeanCentral AmericaChileChinaColombiaCongoCosta RicaCroatiaCubaCzechoslovakiaDenmarkDominicaDominican RepublicEastern AfricaEastern AsiaEastern EuropeEcuadorEgyptEl SalvadorEnglandEritreaEthiopiaEuropeFijiFranceGermanyGhanaGreeceGrenadaGuatemalaGuyanaHaitiHondurasHong KongHungaryIndiaIndonesiaIranIraqIrelandIsraelItalyJamaicaJapanJordanKazakhstanKenyaKoreaKuwaitLaosLatin AmericaLatviaLebanonLiberiaLithuaniaMalaysiaMexicoMicronesiaMiddle AfricaMoldovaMoroccoNepalNetherlandsNicaraguaNigeriaNorth AmericaNorth MacedoniaNorthern AfricaNorthern EuropeNorwayOceaniaPakistanPanamaPeruPhilippinesPolandPortugalRomaniaRussiaSaudi ArabiaScotlandSenegalSerbiaSierra LeoneSingaporeSomaliaSouth AfricaSouth AmericaSouth Central AsiaSouth Eastern AsiaSouthern EuropeSpainSri LankaSt. Vincent and the GrenadinesSudanSwedenSwitzerlandSyriaTaiwanThailandTrinidad and TobagoTurkeyUgandaUkraineUruguayUzbekistanVenezuelaVietnamWest IndiesWestern AfricaWestern AsiaWestern EuropeYemenZaireZimbabweAzores
Single Female Poverty
Income
Poverty
Unemployment
Labor Participation
Family Structure
Vehicle Availability
Education Level
Disability

Single Female Poverty Comparison

Dutch

Immigrants from Singapore

Tragic
Exceptional
22.0%
SINGLE FEMALE POVERTY
4.6/ 100
METRIC RATING
235th/ 347
METRIC RANK
18.3%
SINGLE FEMALE POVERTY
100.0/ 100
METRIC RATING
25th/ 347
METRIC RANK

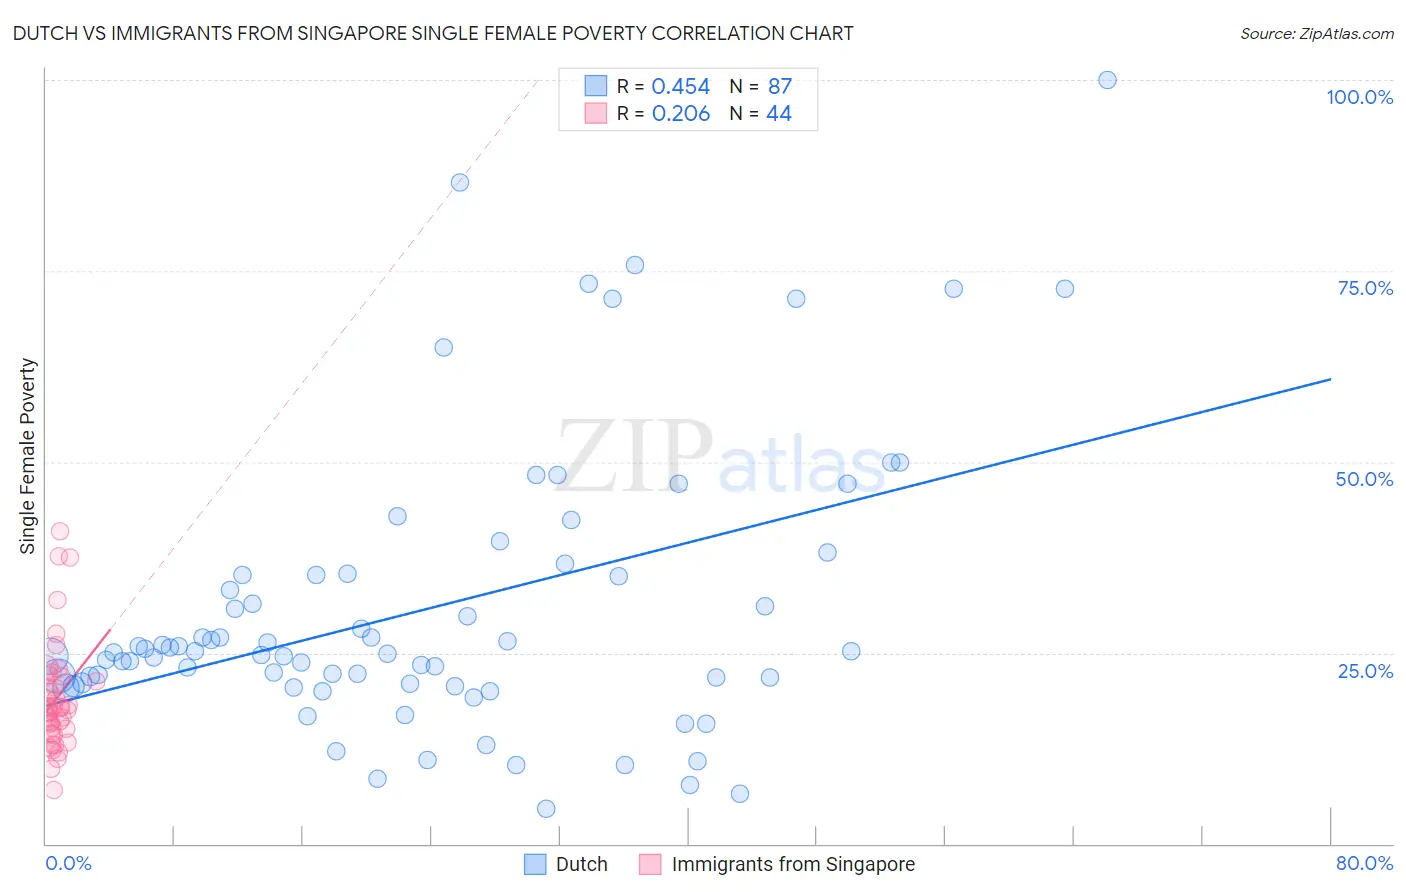
Dutch vs Immigrants from Singapore Single Female Poverty Correlation Chart

The statistical analysis conducted on geographies consisting of 536,025,433 people shows a moderate positive correlation between the proportion of Dutch and poverty level among single females in the United States with a correlation coefficient (R) of 0.454 and weighted average of 22.0%. Similarly, the statistical analysis conducted on geographies consisting of 136,295,396 people shows a weak positive correlation between the proportion of Immigrants from Singapore and poverty level among single females in the United States with a correlation coefficient (R) of 0.206 and weighted average of 18.3%, a difference of 20.0%.
Dutch vs Immigrants from Singapore Single Female Poverty

Single Female Poverty Correlation Summary

MeasurementDutchImmigrants from Singapore
Minimum4.6%7.1%
Maximum100.0%41.0%
Range95.4%33.9%
Mean30.8%19.0%
Median25.0%17.7%
Interquartile 25% (IQ1)20.9%14.8%
Interquartile 75% (IQ3)35.2%21.6%
Interquartile Range (IQR)14.3%6.8%
Standard Deviation (Sample)18.7%7.2%
Standard Deviation (Population)18.6%7.1%

Similar Demographics by Single Female Poverty

Demographics Similar to Dutch by Single Female Poverty

In terms of single female poverty, the demographic groups most similar to Dutch are Spaniard (22.0%, a difference of 0.020%), Spanish (22.0%, a difference of 0.020%), Immigrants from Thailand (22.0%, a difference of 0.12%), Welsh (22.0%, a difference of 0.13%), and Immigrants from Ecuador (22.0%, a difference of 0.16%).
DemographicsRating | RankSingle Female Poverty
Salvadorans
5.5
/100
|
#228
Tragic
21.9%
Tlingit-Haida
5.4
/100
|
#229
Tragic
21.9%
Immigrants | Western Africa
5.3
/100
|
#230
Tragic
22.0%
Welsh
5.0
/100
|
#231
Tragic
22.0%
Immigrants | Thailand
5.0
/100
|
#232
Tragic
22.0%
Spaniards
4.7
/100
|
#233
Tragic
22.0%
Spanish
4.7
/100
|
#234
Tragic
22.0%
Dutch
4.6
/100
|
#235
Tragic
22.0%
Immigrants | Ecuador
4.2
/100
|
#236
Tragic
22.0%
Vietnamese
4.0
/100
|
#237
Tragic
22.0%
French Canadians
2.8
/100
|
#238
Tragic
22.2%
Malaysians
2.8
/100
|
#239
Tragic
22.2%
French
2.3
/100
|
#240
Tragic
22.2%
Cape Verdeans
2.1
/100
|
#241
Tragic
22.3%
Bermudans
2.0
/100
|
#242
Tragic
22.3%

Demographics Similar to Immigrants from Singapore by Single Female Poverty

In terms of single female poverty, the demographic groups most similar to Immigrants from Singapore are Immigrants from Israel (18.3%, a difference of 0.020%), Armenian (18.3%, a difference of 0.10%), Burmese (18.3%, a difference of 0.33%), Asian (18.3%, a difference of 0.33%), and Maltese (18.3%, a difference of 0.34%).
DemographicsRating | RankSingle Female Poverty
Immigrants | Eastern Asia
100.0
/100
|
#18
Exceptional
18.1%
Immigrants | China
100.0
/100
|
#19
Exceptional
18.1%
Immigrants | Greece
100.0
/100
|
#20
Exceptional
18.3%
Maltese
100.0
/100
|
#21
Exceptional
18.3%
Burmese
100.0
/100
|
#22
Exceptional
18.3%
Asians
100.0
/100
|
#23
Exceptional
18.3%
Armenians
100.0
/100
|
#24
Exceptional
18.3%
Immigrants | Singapore
100.0
/100
|
#25
Exceptional
18.3%
Immigrants | Israel
100.0
/100
|
#26
Exceptional
18.3%
Immigrants | Pakistan
100.0
/100
|
#27
Exceptional
18.4%
Immigrants | Moldova
100.0
/100
|
#28
Exceptional
18.5%
Immigrants | Poland
100.0
/100
|
#29
Exceptional
18.5%
Immigrants | North Macedonia
99.9
/100
|
#30
Exceptional
18.5%
Immigrants | Asia
99.9
/100
|
#31
Exceptional
18.6%
Immigrants | Sri Lanka
99.9
/100
|
#32
Exceptional
18.6%