Taiwanese vs Immigrants from Singapore Single Female Poverty
COMPARE
Taiwanese
Immigrants from Singapore
Single Female Poverty
Single Female Poverty Comparison
Taiwanese
Immigrants from Singapore
19.4%
SINGLE FEMALE POVERTY
99.2/ 100
METRIC RATING
83rd/ 347
METRIC RANK
18.3%
SINGLE FEMALE POVERTY
100.0/ 100
METRIC RATING
25th/ 347
METRIC RANK
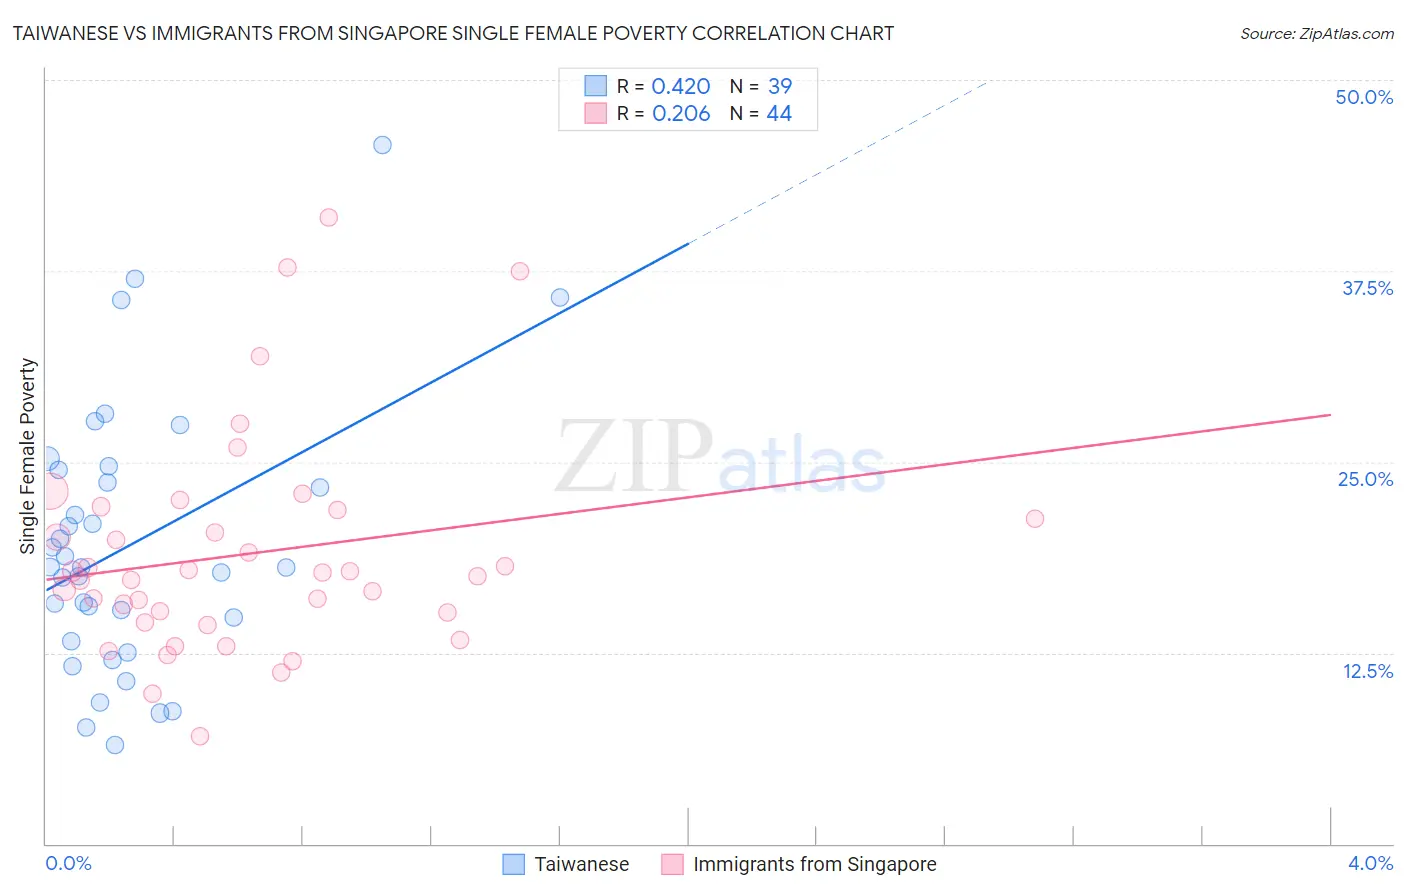
Taiwanese vs Immigrants from Singapore Single Female Poverty Correlation Chart
The statistical analysis conducted on geographies consisting of 31,618,810 people shows a moderate positive correlation between the proportion of Taiwanese and poverty level among single females in the United States with a correlation coefficient (R) of 0.420 and weighted average of 19.4%. Similarly, the statistical analysis conducted on geographies consisting of 136,295,396 people shows a weak positive correlation between the proportion of Immigrants from Singapore and poverty level among single females in the United States with a correlation coefficient (R) of 0.206 and weighted average of 18.3%, a difference of 5.9%.
Single Female Poverty Correlation Summary
| Measurement | Taiwanese | Immigrants from Singapore |
| Minimum | 6.5% | 7.1% |
| Maximum | 45.7% | 41.0% |
| Range | 39.3% | 33.9% |
| Mean | 19.6% | 19.0% |
| Median | 18.1% | 17.7% |
| Interquartile 25% (IQ1) | 13.2% | 14.8% |
| Interquartile 75% (IQ3) | 24.5% | 21.6% |
| Interquartile Range (IQR) | 11.2% | 6.8% |
| Standard Deviation (Sample) | 8.7% | 7.2% |
| Standard Deviation (Population) | 8.6% | 7.1% |
Similar Demographics by Single Female Poverty
Demographics Similar to Taiwanese by Single Female Poverty
In terms of single female poverty, the demographic groups most similar to Taiwanese are Immigrants from Malaysia (19.4%, a difference of 0.010%), Immigrants from Scotland (19.4%, a difference of 0.020%), Immigrants from Australia (19.4%, a difference of 0.050%), Immigrants from Sierra Leone (19.4%, a difference of 0.080%), and Immigrants from Sweden (19.4%, a difference of 0.080%).
| Demographics | Rating | Rank | Single Female Poverty |
| Peruvians | 99.4 /100 | #76 | Exceptional 19.4% |
| Immigrants | Russia | 99.3 /100 | #77 | Exceptional 19.4% |
| Albanians | 99.3 /100 | #78 | Exceptional 19.4% |
| Immigrants | Sierra Leone | 99.3 /100 | #79 | Exceptional 19.4% |
| Immigrants | Australia | 99.3 /100 | #80 | Exceptional 19.4% |
| Immigrants | Scotland | 99.2 /100 | #81 | Exceptional 19.4% |
| Immigrants | Malaysia | 99.2 /100 | #82 | Exceptional 19.4% |
| Taiwanese | 99.2 /100 | #83 | Exceptional 19.4% |
| Immigrants | Sweden | 99.2 /100 | #84 | Exceptional 19.4% |
| Immigrants | Albania | 99.2 /100 | #85 | Exceptional 19.4% |
| Greeks | 99.2 /100 | #86 | Exceptional 19.4% |
| Zimbabweans | 99.0 /100 | #87 | Exceptional 19.5% |
| Afghans | 99.0 /100 | #88 | Exceptional 19.5% |
| Immigrants | Ukraine | 99.0 /100 | #89 | Exceptional 19.5% |
| Immigrants | Lebanon | 98.8 /100 | #90 | Exceptional 19.6% |
Demographics Similar to Immigrants from Singapore by Single Female Poverty
In terms of single female poverty, the demographic groups most similar to Immigrants from Singapore are Immigrants from Israel (18.3%, a difference of 0.020%), Armenian (18.3%, a difference of 0.10%), Burmese (18.3%, a difference of 0.33%), Asian (18.3%, a difference of 0.33%), and Maltese (18.3%, a difference of 0.34%).
| Demographics | Rating | Rank | Single Female Poverty |
| Immigrants | Eastern Asia | 100.0 /100 | #18 | Exceptional 18.1% |
| Immigrants | China | 100.0 /100 | #19 | Exceptional 18.1% |
| Immigrants | Greece | 100.0 /100 | #20 | Exceptional 18.3% |
| Maltese | 100.0 /100 | #21 | Exceptional 18.3% |
| Burmese | 100.0 /100 | #22 | Exceptional 18.3% |
| Asians | 100.0 /100 | #23 | Exceptional 18.3% |
| Armenians | 100.0 /100 | #24 | Exceptional 18.3% |
| Immigrants | Singapore | 100.0 /100 | #25 | Exceptional 18.3% |
| Immigrants | Israel | 100.0 /100 | #26 | Exceptional 18.3% |
| Immigrants | Pakistan | 100.0 /100 | #27 | Exceptional 18.4% |
| Immigrants | Moldova | 100.0 /100 | #28 | Exceptional 18.5% |
| Immigrants | Poland | 100.0 /100 | #29 | Exceptional 18.5% |
| Immigrants | North Macedonia | 99.9 /100 | #30 | Exceptional 18.5% |
| Immigrants | Asia | 99.9 /100 | #31 | Exceptional 18.6% |
| Immigrants | Sri Lanka | 99.9 /100 | #32 | Exceptional 18.6% |