Nicaraguan vs Native/Alaskan Single Female Poverty
COMPARE
Nicaraguan
Native/Alaskan
Single Female Poverty
Single Female Poverty Comparison
Nicaraguans
Natives/Alaskans
21.3%
SINGLE FEMALE POVERTY
27.6/ 100
METRIC RATING
195th/ 347
METRIC RANK
28.2%
SINGLE FEMALE POVERTY
0.0/ 100
METRIC RATING
331st/ 347
METRIC RANK
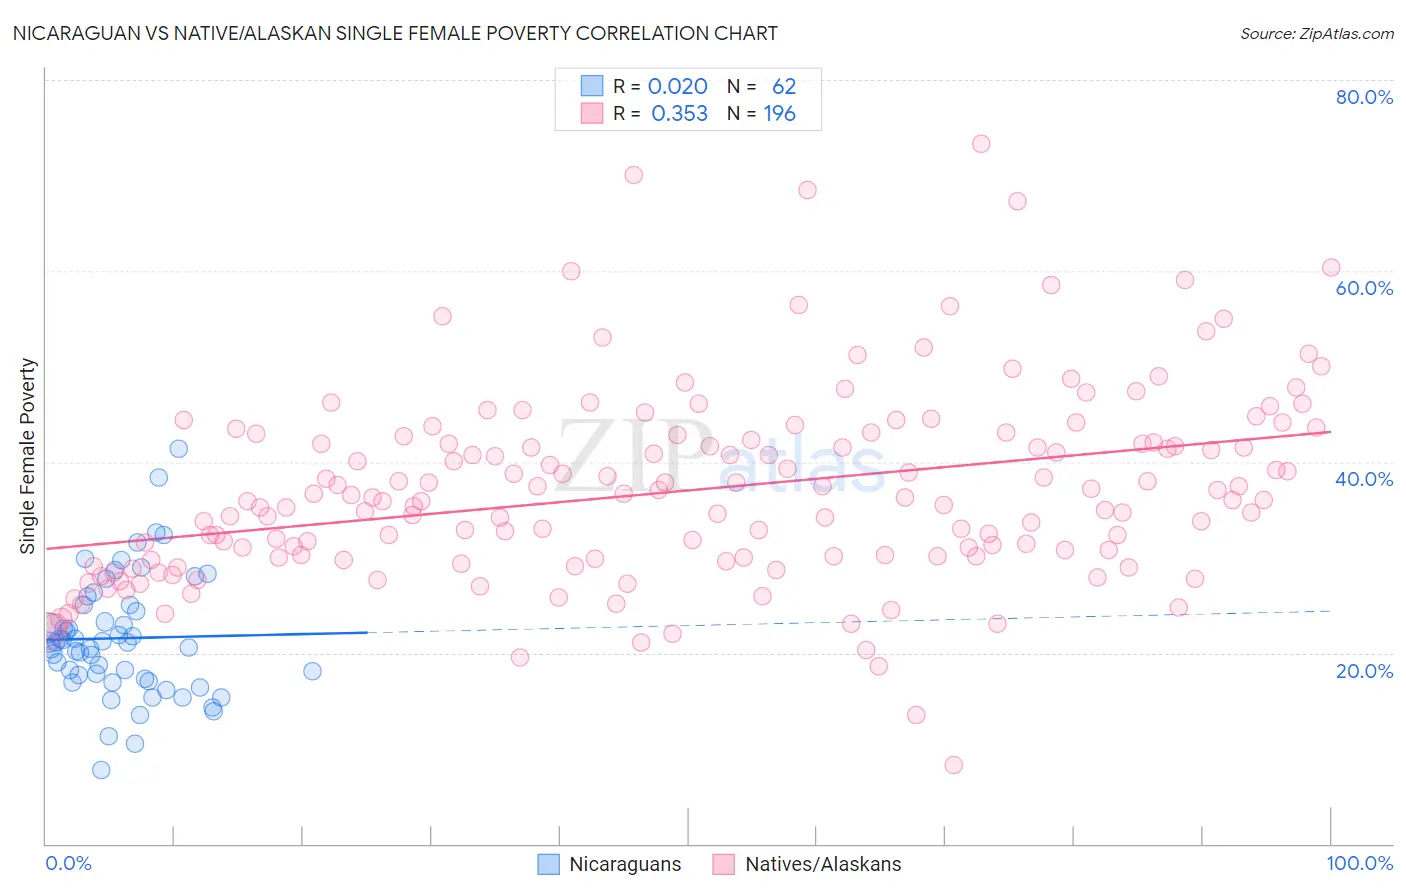
Nicaraguan vs Native/Alaskan Single Female Poverty Correlation Chart
The statistical analysis conducted on geographies consisting of 283,867,505 people shows no correlation between the proportion of Nicaraguans and poverty level among single females in the United States with a correlation coefficient (R) of 0.020 and weighted average of 21.3%. Similarly, the statistical analysis conducted on geographies consisting of 503,027,149 people shows a mild positive correlation between the proportion of Natives/Alaskans and poverty level among single females in the United States with a correlation coefficient (R) of 0.353 and weighted average of 28.2%, a difference of 32.3%.
Single Female Poverty Correlation Summary
| Measurement | Nicaraguan | Native/Alaskan |
| Minimum | 7.8% | 8.3% |
| Maximum | 41.4% | 73.3% |
| Range | 33.6% | 65.1% |
| Mean | 21.5% | 37.0% |
| Median | 21.1% | 36.0% |
| Interquartile 25% (IQ1) | 17.2% | 30.0% |
| Interquartile 75% (IQ3) | 24.9% | 42.5% |
| Interquartile Range (IQR) | 7.7% | 12.5% |
| Standard Deviation (Sample) | 6.3% | 10.1% |
| Standard Deviation (Population) | 6.3% | 10.1% |
Similar Demographics by Single Female Poverty
Demographics Similar to Nicaraguans by Single Female Poverty
In terms of single female poverty, the demographic groups most similar to Nicaraguans are Czechoslovakian (21.3%, a difference of 0.010%), Basque (21.3%, a difference of 0.040%), Immigrants from Saudi Arabia (21.3%, a difference of 0.040%), Japanese (21.3%, a difference of 0.090%), and Immigrants from Jamaica (21.3%, a difference of 0.22%).
| Demographics | Rating | Rank | Single Female Poverty |
| Yugoslavians | 35.4 /100 | #188 | Fair 21.2% |
| Immigrants | Cuba | 35.3 /100 | #189 | Fair 21.2% |
| Trinidadians and Tobagonians | 35.2 /100 | #190 | Fair 21.2% |
| Immigrants | Germany | 31.1 /100 | #191 | Fair 21.3% |
| Immigrants | Jamaica | 30.5 /100 | #192 | Fair 21.3% |
| Basques | 28.1 /100 | #193 | Fair 21.3% |
| Czechoslovakians | 27.7 /100 | #194 | Fair 21.3% |
| Nicaraguans | 27.6 /100 | #195 | Fair 21.3% |
| Immigrants | Saudi Arabia | 27.1 /100 | #196 | Fair 21.3% |
| Japanese | 26.4 /100 | #197 | Fair 21.3% |
| Swiss | 24.2 /100 | #198 | Fair 21.4% |
| Immigrants | Immigrants | 22.0 /100 | #199 | Fair 21.4% |
| Irish | 21.4 /100 | #200 | Fair 21.4% |
| Nigerians | 20.9 /100 | #201 | Fair 21.4% |
| Immigrants | Kenya | 20.7 /100 | #202 | Fair 21.4% |
Demographics Similar to Natives/Alaskans by Single Female Poverty
In terms of single female poverty, the demographic groups most similar to Natives/Alaskans are Yakama (28.3%, a difference of 0.26%), Hopi (28.0%, a difference of 0.64%), Ute (28.4%, a difference of 0.68%), Menominee (27.8%, a difference of 1.3%), and Pueblo (28.6%, a difference of 1.4%).
| Demographics | Rating | Rank | Single Female Poverty |
| Kiowa | 0.0 /100 | #324 | Tragic 26.9% |
| Choctaw | 0.0 /100 | #325 | Tragic 27.2% |
| Creek | 0.0 /100 | #326 | Tragic 27.4% |
| Dutch West Indians | 0.0 /100 | #327 | Tragic 27.5% |
| Apache | 0.0 /100 | #328 | Tragic 27.7% |
| Menominee | 0.0 /100 | #329 | Tragic 27.8% |
| Hopi | 0.0 /100 | #330 | Tragic 28.0% |
| Natives/Alaskans | 0.0 /100 | #331 | Tragic 28.2% |
| Yakama | 0.0 /100 | #332 | Tragic 28.3% |
| Ute | 0.0 /100 | #333 | Tragic 28.4% |
| Pueblo | 0.0 /100 | #334 | Tragic 28.6% |
| Immigrants | Yemen | 0.0 /100 | #335 | Tragic 28.9% |
| Colville | 0.0 /100 | #336 | Tragic 29.1% |
| Yuman | 0.0 /100 | #337 | Tragic 29.4% |
| Pima | 0.0 /100 | #338 | Tragic 30.3% |