Nicaraguan vs Native/Alaskan Householder Income Ages 25 - 44 years

COMPARE

Nicaraguan
Race
Ancestry
AfghanAfricanAlaska NativeAlaskan AthabascanAlbanianAleutAlsatianAmericanApacheArabArapahoArgentineanArmenianAssyrian/Chaldean/SyriacAustralianAustrianBahamianBangladeshiBarbadianBasqueBelgianBelizeanBermudanBhutaneseBlackfeetBolivianBrazilianBritishBritish West IndianBulgarianBurmeseCajunCambodianCanadianCape VerdeanCarpatho RusynCelticCentral AmericanCentral American IndianCherokeeCheyenneChickasawChileanChineseChippewaChoctawColombianColvilleComancheCosta RicanCreeCreekCroatianCrowCubanCypriotCzechCzechoslovakianDanishDelawareDominicanDutchDutch West IndianEastern EuropeanEcuadorianEgyptianEnglishEstonianEthiopianEuropeanFijianFilipinoFinnishFrenchFrench American IndianFrench CanadianGermanGerman RussianGhanaianGreekGuamanian/ChamorroGuatemalanGuyaneseHaitianHmongHonduranHopiHoumaHungarianIcelanderIndian (Asian)IndonesianInupiatIranianIraqiIrishIroquoisIsraeliItalianJamaicanJapaneseJordanianKenyanKiowaKoreanLaotianLatvianLebaneseLiberianLithuanianLumbeeLuxembourgerMacedonianMalaysianMalteseMarshalleseMenomineeMexicanMexican American IndianMongolianMoroccanNative HawaiianNavajoNepaleseNew ZealanderNicaraguanNigerianNorthern EuropeanNorwegianOkinawanOsageOttawaPaiutePakistaniPalestinianPanamanianParaguayanPennsylvania GermanPeruvianPimaPolishPortuguesePotawatomiPuebloPuerto RicanPuget Sound SalishRomanianRussianSalvadoranSamoanScandinavianScotch-IrishScottishSeminoleSenegaleseSerbianShoshoneSierra LeoneanSiouxSlavicSlovakSloveneSomaliSouth AfricanSouth AmericanSouth American IndianSoviet UnionSpaniardSpanishSpanish AmericanSpanish American IndianSri LankanSubsaharan AfricanSudaneseSwedishSwissSyrianTaiwaneseThaiTlingit-HaidaTohono O'OdhamTonganTrinidadian and TobagonianTsimshianTurkishU.S. Virgin IslanderUgandanUkrainianUruguayanUteVenezuelanVietnameseWelshWest IndianYakamaYaquiYugoslavianYumanYup'ikZimbabwean
Immigration
NonimmigrantsImmigrantsAfghanistanAfricaAlbaniaArgentinaArmeniaAsiaAustraliaAustriaBahamasBangladeshBarbadosBelarusBelgiumBelizeBoliviaBosnia and HerzegovinaBrazilBulgariaBurma/MyanmarCabo VerdeCambodiaCameroonCanadaCaribbeanCentral AmericaChileChinaColombiaCongoCosta RicaCroatiaCubaCzechoslovakiaDenmarkDominicaDominican RepublicEastern AfricaEastern AsiaEastern EuropeEcuadorEgyptEl SalvadorEnglandEritreaEthiopiaEuropeFijiFranceGermanyGhanaGreeceGrenadaGuatemalaGuyanaHaitiHondurasHong KongHungaryIndiaIndonesiaIranIraqIrelandIsraelItalyJamaicaJapanJordanKazakhstanKenyaKoreaKuwaitLaosLatin AmericaLatviaLebanonLiberiaLithuaniaMalaysiaMexicoMicronesiaMiddle AfricaMoldovaMoroccoNepalNetherlandsNicaraguaNigeriaNorth AmericaNorth MacedoniaNorthern AfricaNorthern EuropeNorwayOceaniaPakistanPanamaPeruPhilippinesPolandPortugalRomaniaRussiaSaudi ArabiaScotlandSenegalSerbiaSierra LeoneSingaporeSomaliaSouth AfricaSouth AmericaSouth Central AsiaSouth Eastern AsiaSouthern EuropeSpainSri LankaSt. Vincent and the GrenadinesSudanSwedenSwitzerlandSyriaTaiwanThailandTrinidad and TobagoTurkeyUgandaUkraineUruguayUzbekistanVenezuelaVietnamWest IndiesWestern AfricaWestern AsiaWestern EuropeYemenZaireZimbabweAzores
Native/Alaskan
Race
Ancestry
AfghanAfricanAlaska NativeAlaskan AthabascanAlbanianAleutAlsatianAmericanApacheArabArapahoArgentineanArmenianAssyrian/Chaldean/SyriacAustralianAustrianBahamianBangladeshiBarbadianBasqueBelgianBelizeanBermudanBhutaneseBlackfeetBolivianBrazilianBritishBritish West IndianBulgarianBurmeseCajunCambodianCanadianCape VerdeanCarpatho RusynCelticCentral AmericanCentral American IndianCherokeeCheyenneChickasawChileanChineseChippewaChoctawColombianColvilleComancheCosta RicanCreeCreekCroatianCrowCubanCypriotCzechCzechoslovakianDanishDelawareDominicanDutchDutch West IndianEastern EuropeanEcuadorianEgyptianEnglishEstonianEthiopianEuropeanFijianFilipinoFinnishFrenchFrench American IndianFrench CanadianGermanGerman RussianGhanaianGreekGuamanian/ChamorroGuatemalanGuyaneseHaitianHmongHonduranHopiHoumaHungarianIcelanderIndian (Asian)IndonesianInupiatIranianIraqiIrishIroquoisIsraeliItalianJamaicanJapaneseJordanianKenyanKiowaKoreanLaotianLatvianLebaneseLiberianLithuanianLumbeeLuxembourgerMacedonianMalaysianMalteseMarshalleseMenomineeMexicanMexican American IndianMongolianMoroccanNative HawaiianNavajoNepaleseNew ZealanderNigerianNorthern EuropeanNorwegianOkinawanOsageOttawaPaiutePakistaniPalestinianPanamanianParaguayanPennsylvania GermanPeruvianPimaPolishPortuguesePotawatomiPuebloPuerto RicanPuget Sound SalishRomanianRussianSalvadoranSamoanScandinavianScotch-IrishScottishSeminoleSenegaleseSerbianShoshoneSierra LeoneanSiouxSlavicSlovakSloveneSomaliSouth AfricanSouth AmericanSouth American IndianSoviet UnionSpaniardSpanishSpanish AmericanSpanish American IndianSri LankanSubsaharan AfricanSudaneseSwedishSwissSyrianTaiwaneseThaiTlingit-HaidaTohono O'OdhamTonganTrinidadian and TobagonianTsimshianTurkishU.S. Virgin IslanderUgandanUkrainianUruguayanUteVenezuelanVietnameseWelshWest IndianYakamaYaquiYugoslavianYumanYup'ikZimbabwean
Immigration
NonimmigrantsImmigrantsAfghanistanAfricaAlbaniaArgentinaArmeniaAsiaAustraliaAustriaBahamasBangladeshBarbadosBelarusBelgiumBelizeBoliviaBosnia and HerzegovinaBrazilBulgariaBurma/MyanmarCabo VerdeCambodiaCameroonCanadaCaribbeanCentral AmericaChileChinaColombiaCongoCosta RicaCroatiaCubaCzechoslovakiaDenmarkDominicaDominican RepublicEastern AfricaEastern AsiaEastern EuropeEcuadorEgyptEl SalvadorEnglandEritreaEthiopiaEuropeFijiFranceGermanyGhanaGreeceGrenadaGuatemalaGuyanaHaitiHondurasHong KongHungaryIndiaIndonesiaIranIraqIrelandIsraelItalyJamaicaJapanJordanKazakhstanKenyaKoreaKuwaitLaosLatin AmericaLatviaLebanonLiberiaLithuaniaMalaysiaMexicoMicronesiaMiddle AfricaMoldovaMoroccoNepalNetherlandsNicaraguaNigeriaNorth AmericaNorth MacedoniaNorthern AfricaNorthern EuropeNorwayOceaniaPakistanPanamaPeruPhilippinesPolandPortugalRomaniaRussiaSaudi ArabiaScotlandSenegalSerbiaSierra LeoneSingaporeSomaliaSouth AfricaSouth AmericaSouth Central AsiaSouth Eastern AsiaSouthern EuropeSpainSri LankaSt. Vincent and the GrenadinesSudanSwedenSwitzerlandSyriaTaiwanThailandTrinidad and TobagoTurkeyUgandaUkraineUruguayUzbekistanVenezuelaVietnamWest IndiesWestern AfricaWestern AsiaWestern EuropeYemenZaireZimbabweAzores
Householder Income Ages 25 - 44 years
Income
Poverty
Unemployment
Labor Participation
Family Structure
Vehicle Availability
Education Level
Disability

Householder Income Ages 25 - 44 years Comparison

Nicaraguans

Natives/Alaskans

Tragic
Tragic
$87,751
HOUSEHOLDER INCOME AGES 25 - 44 YEARS
2.2/ 100
METRIC RATING
240th/ 347
METRIC RANK
$75,647
HOUSEHOLDER INCOME AGES 25 - 44 YEARS
0.0/ 100
METRIC RATING
331st/ 347
METRIC RANK

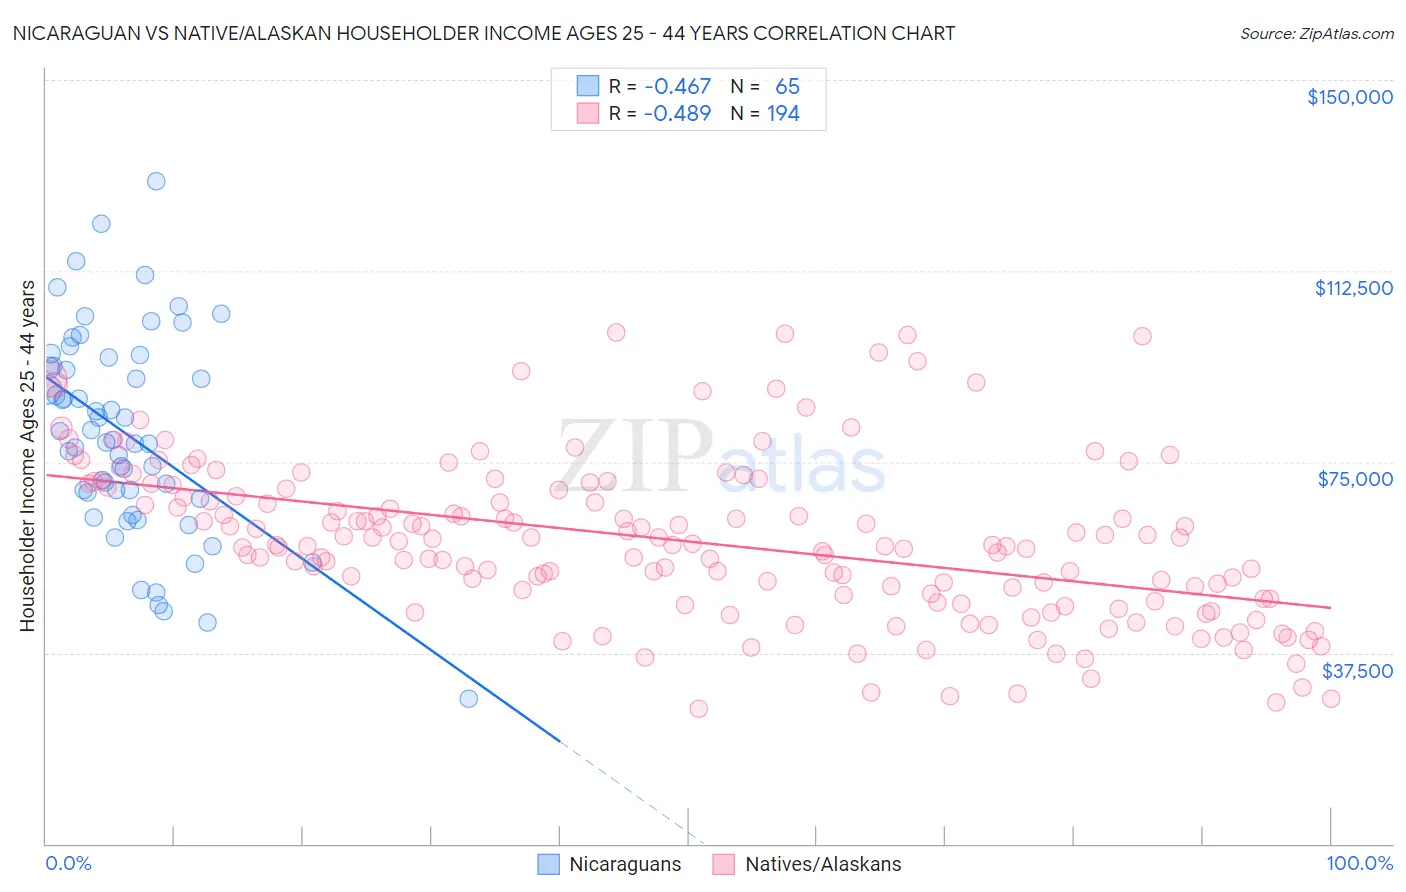
Nicaraguan vs Native/Alaskan Householder Income Ages 25 - 44 years Correlation Chart

The statistical analysis conducted on geographies consisting of 285,307,176 people shows a moderate negative correlation between the proportion of Nicaraguans and household income with householder between the ages 25 and 44 in the United States with a correlation coefficient (R) of -0.467 and weighted average of $87,751. Similarly, the statistical analysis conducted on geographies consisting of 509,973,002 people shows a moderate negative correlation between the proportion of Natives/Alaskans and household income with householder between the ages 25 and 44 in the United States with a correlation coefficient (R) of -0.489 and weighted average of $75,647, a difference of 16.0%.
Nicaraguan vs Native/Alaskan Householder Income Ages 25 - 44 years

Householder Income Ages 25 - 44 years Correlation Summary

MeasurementNicaraguanNative/Alaskan
Minimum$28,500$26,585
Maximum$130,179$100,355
Range$101,679$73,770
Mean$80,440$59,417
Median$79,185$58,652
Interquartile 25% (IQ1)$68,448$48,151
Interquartile 75% (IQ3)$94,672$69,627
Interquartile Range (IQR)$26,224$21,476
Standard Deviation (Sample)$20,031$15,647
Standard Deviation (Population)$19,876$15,607

Similar Demographics by Householder Income Ages 25 - 44 years

Demographics Similar to Nicaraguans by Householder Income Ages 25 - 44 years

In terms of householder income ages 25 - 44 years, the demographic groups most similar to Nicaraguans are Immigrants from Ghana ($87,760, a difference of 0.010%), Nigerian ($87,730, a difference of 0.020%), Alaska Native ($88,018, a difference of 0.30%), Salvadoran ($88,198, a difference of 0.51%), and Immigrants from Cameroon ($88,214, a difference of 0.53%).
DemographicsRating | RankHouseholder Income Ages 25 - 44 years
Malaysians
3.0
/100
|
#233
Tragic
$88,291
Venezuelans
2.9
/100
|
#234
Tragic
$88,232
Bermudans
2.9
/100
|
#235
Tragic
$88,231
Immigrants | Cameroon
2.9
/100
|
#236
Tragic
$88,214
Salvadorans
2.8
/100
|
#237
Tragic
$88,198
Alaska Natives
2.6
/100
|
#238
Tragic
$88,018
Immigrants | Ghana
2.2
/100
|
#239
Tragic
$87,760
Nicaraguans
2.2
/100
|
#240
Tragic
$87,751
Nigerians
2.2
/100
|
#241
Tragic
$87,730
West Indians
1.7
/100
|
#242
Tragic
$87,205
Immigrants | West Indies
1.5
/100
|
#243
Tragic
$87,063
Immigrants | Venezuela
1.5
/100
|
#244
Tragic
$87,038
Immigrants | El Salvador
1.4
/100
|
#245
Tragic
$86,913
Immigrants | Burma/Myanmar
1.3
/100
|
#246
Tragic
$86,736
Immigrants | Nigeria
1.2
/100
|
#247
Tragic
$86,589

Demographics Similar to Natives/Alaskans by Householder Income Ages 25 - 44 years

In terms of householder income ages 25 - 44 years, the demographic groups most similar to Natives/Alaskans are Bahamian ($75,395, a difference of 0.34%), Yakama ($76,226, a difference of 0.76%), Hopi ($75,002, a difference of 0.86%), Creek ($74,847, a difference of 1.1%), and Kiowa ($74,776, a difference of 1.2%).
DemographicsRating | RankHouseholder Income Ages 25 - 44 years
Dutch West Indians
0.0
/100
|
#324
Tragic
$77,260
Sioux
0.0
/100
|
#325
Tragic
$77,089
Houma
0.0
/100
|
#326
Tragic
$77,044
Immigrants | Bahamas
0.0
/100
|
#327
Tragic
$76,910
Immigrants | Cuba
0.0
/100
|
#328
Tragic
$76,701
Seminole
0.0
/100
|
#329
Tragic
$76,584
Yakama
0.0
/100
|
#330
Tragic
$76,226
Natives/Alaskans
0.0
/100
|
#331
Tragic
$75,647
Bahamians
0.0
/100
|
#332
Tragic
$75,395
Hopi
0.0
/100
|
#333
Tragic
$75,002
Creek
0.0
/100
|
#334
Tragic
$74,847
Kiowa
0.0
/100
|
#335
Tragic
$74,776
Yup'ik
0.0
/100
|
#336
Tragic
$73,688
Blacks/African Americans
0.0
/100
|
#337
Tragic
$73,370
Immigrants | Yemen
0.0
/100
|
#338
Tragic
$73,043