Nicaraguan vs Immigrants from Romania Single Female Poverty
COMPARE
Nicaraguan
Immigrants from Romania
Single Female Poverty
Single Female Poverty Comparison
Nicaraguans
Immigrants from Romania
21.3%
SINGLE FEMALE POVERTY
27.6/ 100
METRIC RATING
195th/ 347
METRIC RANK
18.8%
SINGLE FEMALE POVERTY
99.9/ 100
METRIC RATING
43rd/ 347
METRIC RANK
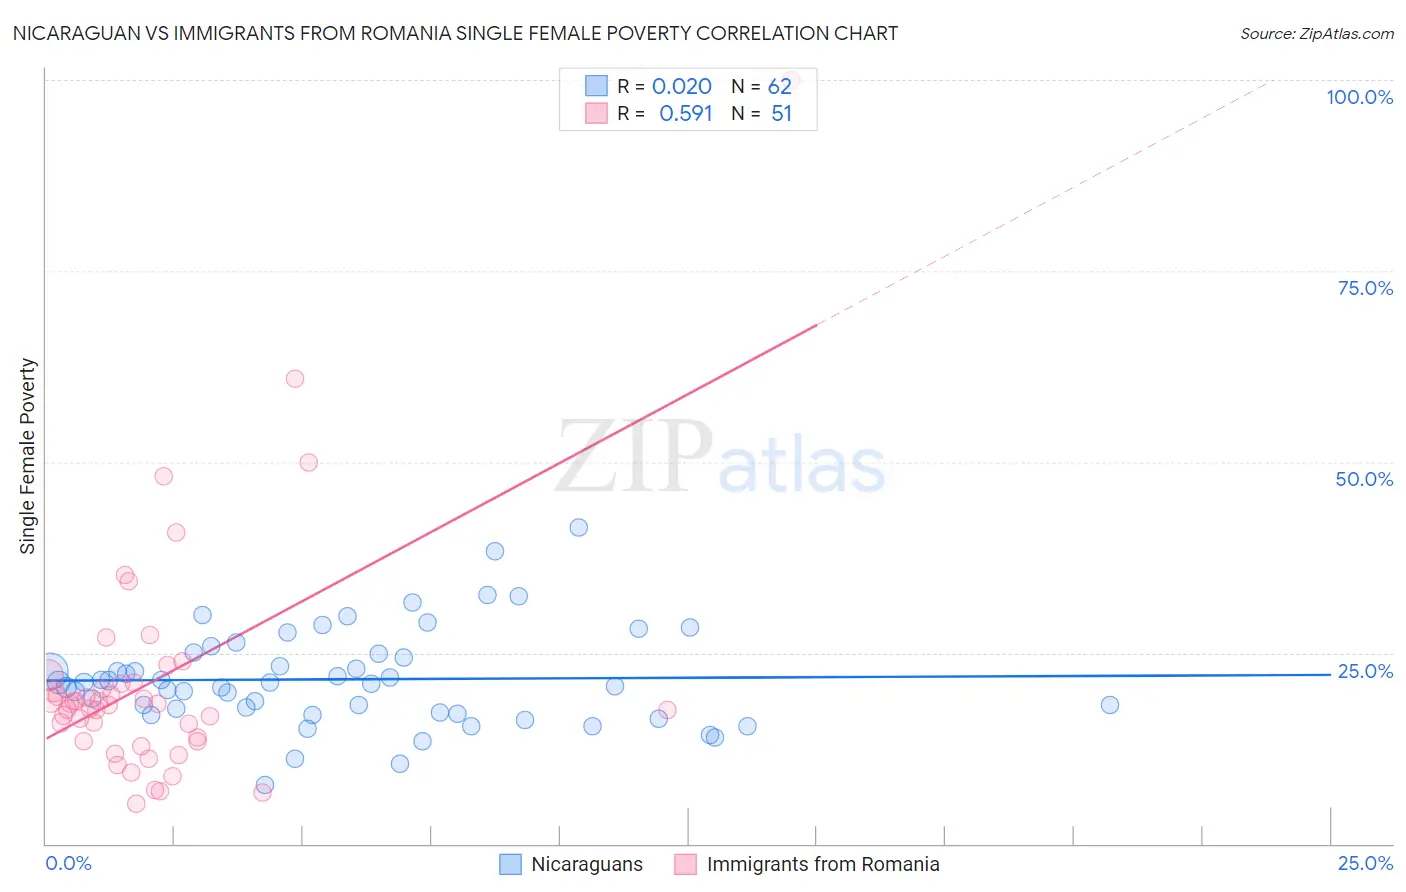
Nicaraguan vs Immigrants from Romania Single Female Poverty Correlation Chart
The statistical analysis conducted on geographies consisting of 283,867,505 people shows no correlation between the proportion of Nicaraguans and poverty level among single females in the United States with a correlation coefficient (R) of 0.020 and weighted average of 21.3%. Similarly, the statistical analysis conducted on geographies consisting of 254,376,234 people shows a substantial positive correlation between the proportion of Immigrants from Romania and poverty level among single females in the United States with a correlation coefficient (R) of 0.591 and weighted average of 18.8%, a difference of 13.2%.
Single Female Poverty Correlation Summary
| Measurement | Nicaraguan | Immigrants from Romania |
| Minimum | 7.8% | 5.2% |
| Maximum | 41.4% | 100.0% |
| Range | 33.6% | 94.8% |
| Mean | 21.5% | 21.4% |
| Median | 21.1% | 18.3% |
| Interquartile 25% (IQ1) | 17.2% | 13.5% |
| Interquartile 75% (IQ3) | 24.9% | 21.2% |
| Interquartile Range (IQR) | 7.7% | 7.7% |
| Standard Deviation (Sample) | 6.3% | 15.7% |
| Standard Deviation (Population) | 6.3% | 15.5% |
Similar Demographics by Single Female Poverty
Demographics Similar to Nicaraguans by Single Female Poverty
In terms of single female poverty, the demographic groups most similar to Nicaraguans are Czechoslovakian (21.3%, a difference of 0.010%), Basque (21.3%, a difference of 0.040%), Immigrants from Saudi Arabia (21.3%, a difference of 0.040%), Japanese (21.3%, a difference of 0.090%), and Immigrants from Jamaica (21.3%, a difference of 0.22%).
| Demographics | Rating | Rank | Single Female Poverty |
| Yugoslavians | 35.4 /100 | #188 | Fair 21.2% |
| Immigrants | Cuba | 35.3 /100 | #189 | Fair 21.2% |
| Trinidadians and Tobagonians | 35.2 /100 | #190 | Fair 21.2% |
| Immigrants | Germany | 31.1 /100 | #191 | Fair 21.3% |
| Immigrants | Jamaica | 30.5 /100 | #192 | Fair 21.3% |
| Basques | 28.1 /100 | #193 | Fair 21.3% |
| Czechoslovakians | 27.7 /100 | #194 | Fair 21.3% |
| Nicaraguans | 27.6 /100 | #195 | Fair 21.3% |
| Immigrants | Saudi Arabia | 27.1 /100 | #196 | Fair 21.3% |
| Japanese | 26.4 /100 | #197 | Fair 21.3% |
| Swiss | 24.2 /100 | #198 | Fair 21.4% |
| Immigrants | Immigrants | 22.0 /100 | #199 | Fair 21.4% |
| Irish | 21.4 /100 | #200 | Fair 21.4% |
| Nigerians | 20.9 /100 | #201 | Fair 21.4% |
| Immigrants | Kenya | 20.7 /100 | #202 | Fair 21.4% |
Demographics Similar to Immigrants from Romania by Single Female Poverty
In terms of single female poverty, the demographic groups most similar to Immigrants from Romania are Jordanian (18.8%, a difference of 0.15%), Immigrants from Croatia (18.9%, a difference of 0.17%), Immigrants from Serbia (18.8%, a difference of 0.23%), Okinawan (18.8%, a difference of 0.25%), and Bulgarian (18.8%, a difference of 0.28%).
| Demographics | Rating | Rank | Single Female Poverty |
| Turks | 99.9 /100 | #36 | Exceptional 18.7% |
| Immigrants | Armenia | 99.9 /100 | #37 | Exceptional 18.7% |
| Tongans | 99.9 /100 | #38 | Exceptional 18.8% |
| Bulgarians | 99.9 /100 | #39 | Exceptional 18.8% |
| Okinawans | 99.9 /100 | #40 | Exceptional 18.8% |
| Immigrants | Serbia | 99.9 /100 | #41 | Exceptional 18.8% |
| Jordanians | 99.9 /100 | #42 | Exceptional 18.8% |
| Immigrants | Romania | 99.9 /100 | #43 | Exceptional 18.8% |
| Immigrants | Croatia | 99.9 /100 | #44 | Exceptional 18.9% |
| Immigrants | Indonesia | 99.8 /100 | #45 | Exceptional 18.9% |
| Macedonians | 99.8 /100 | #46 | Exceptional 18.9% |
| Latvians | 99.8 /100 | #47 | Exceptional 19.0% |
| Immigrants | Argentina | 99.8 /100 | #48 | Exceptional 19.0% |
| Immigrants | Czechoslovakia | 99.8 /100 | #49 | Exceptional 19.0% |
| Immigrants | Eastern Europe | 99.8 /100 | #50 | Exceptional 19.0% |