Immigrants from Croatia vs Native/Alaskan Single Female Poverty
COMPARE
Immigrants from Croatia
Native/Alaskan
Single Female Poverty
Single Female Poverty Comparison
Immigrants from Croatia
Natives/Alaskans
18.9%
SINGLE FEMALE POVERTY
99.9/ 100
METRIC RATING
44th/ 347
METRIC RANK
28.2%
SINGLE FEMALE POVERTY
0.0/ 100
METRIC RATING
331st/ 347
METRIC RANK
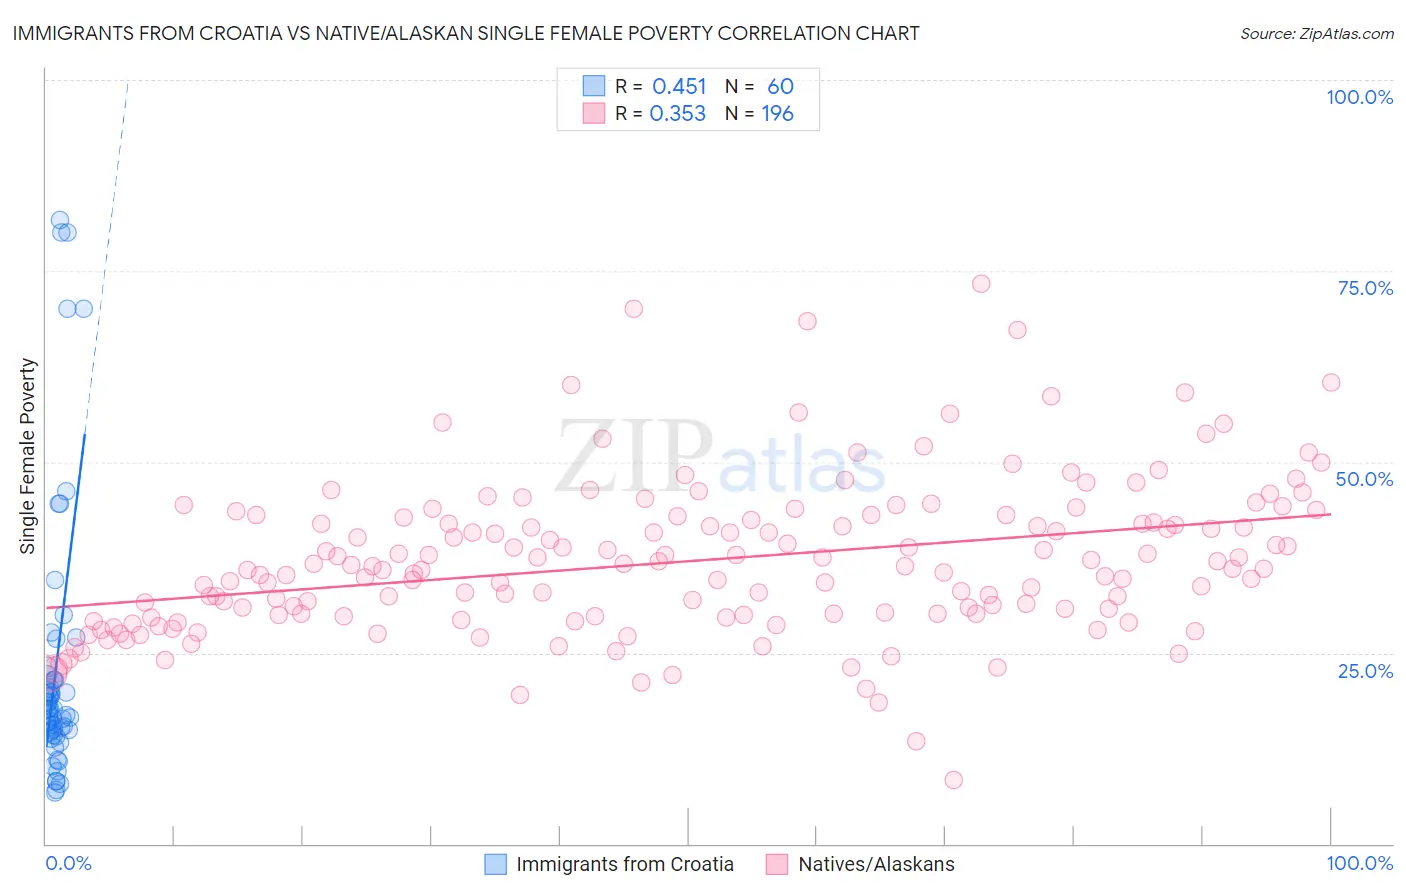
Immigrants from Croatia vs Native/Alaskan Single Female Poverty Correlation Chart
The statistical analysis conducted on geographies consisting of 131,494,560 people shows a moderate positive correlation between the proportion of Immigrants from Croatia and poverty level among single females in the United States with a correlation coefficient (R) of 0.451 and weighted average of 18.9%. Similarly, the statistical analysis conducted on geographies consisting of 503,027,149 people shows a mild positive correlation between the proportion of Natives/Alaskans and poverty level among single females in the United States with a correlation coefficient (R) of 0.353 and weighted average of 28.2%, a difference of 49.5%.
Single Female Poverty Correlation Summary
| Measurement | Immigrants from Croatia | Native/Alaskan |
| Minimum | 6.7% | 8.3% |
| Maximum | 81.7% | 73.3% |
| Range | 74.9% | 65.1% |
| Mean | 23.4% | 37.0% |
| Median | 17.6% | 36.0% |
| Interquartile 25% (IQ1) | 14.7% | 30.0% |
| Interquartile 75% (IQ3) | 21.8% | 42.5% |
| Interquartile Range (IQR) | 7.1% | 12.5% |
| Standard Deviation (Sample) | 18.1% | 10.1% |
| Standard Deviation (Population) | 18.0% | 10.1% |
Similar Demographics by Single Female Poverty
Demographics Similar to Immigrants from Croatia by Single Female Poverty
In terms of single female poverty, the demographic groups most similar to Immigrants from Croatia are Immigrants from Romania (18.8%, a difference of 0.17%), Immigrants from Indonesia (18.9%, a difference of 0.21%), Jordanian (18.8%, a difference of 0.32%), Macedonian (18.9%, a difference of 0.38%), and Immigrants from Serbia (18.8%, a difference of 0.40%).
| Demographics | Rating | Rank | Single Female Poverty |
| Immigrants | Armenia | 99.9 /100 | #37 | Exceptional 18.7% |
| Tongans | 99.9 /100 | #38 | Exceptional 18.8% |
| Bulgarians | 99.9 /100 | #39 | Exceptional 18.8% |
| Okinawans | 99.9 /100 | #40 | Exceptional 18.8% |
| Immigrants | Serbia | 99.9 /100 | #41 | Exceptional 18.8% |
| Jordanians | 99.9 /100 | #42 | Exceptional 18.8% |
| Immigrants | Romania | 99.9 /100 | #43 | Exceptional 18.8% |
| Immigrants | Croatia | 99.9 /100 | #44 | Exceptional 18.9% |
| Immigrants | Indonesia | 99.8 /100 | #45 | Exceptional 18.9% |
| Macedonians | 99.8 /100 | #46 | Exceptional 18.9% |
| Latvians | 99.8 /100 | #47 | Exceptional 19.0% |
| Immigrants | Argentina | 99.8 /100 | #48 | Exceptional 19.0% |
| Immigrants | Czechoslovakia | 99.8 /100 | #49 | Exceptional 19.0% |
| Immigrants | Eastern Europe | 99.8 /100 | #50 | Exceptional 19.0% |
| Immigrants | Italy | 99.8 /100 | #51 | Exceptional 19.0% |
Demographics Similar to Natives/Alaskans by Single Female Poverty
In terms of single female poverty, the demographic groups most similar to Natives/Alaskans are Yakama (28.3%, a difference of 0.26%), Hopi (28.0%, a difference of 0.64%), Ute (28.4%, a difference of 0.68%), Menominee (27.8%, a difference of 1.3%), and Pueblo (28.6%, a difference of 1.4%).
| Demographics | Rating | Rank | Single Female Poverty |
| Kiowa | 0.0 /100 | #324 | Tragic 26.9% |
| Choctaw | 0.0 /100 | #325 | Tragic 27.2% |
| Creek | 0.0 /100 | #326 | Tragic 27.4% |
| Dutch West Indians | 0.0 /100 | #327 | Tragic 27.5% |
| Apache | 0.0 /100 | #328 | Tragic 27.7% |
| Menominee | 0.0 /100 | #329 | Tragic 27.8% |
| Hopi | 0.0 /100 | #330 | Tragic 28.0% |
| Natives/Alaskans | 0.0 /100 | #331 | Tragic 28.2% |
| Yakama | 0.0 /100 | #332 | Tragic 28.3% |
| Ute | 0.0 /100 | #333 | Tragic 28.4% |
| Pueblo | 0.0 /100 | #334 | Tragic 28.6% |
| Immigrants | Yemen | 0.0 /100 | #335 | Tragic 28.9% |
| Colville | 0.0 /100 | #336 | Tragic 29.1% |
| Yuman | 0.0 /100 | #337 | Tragic 29.4% |
| Pima | 0.0 /100 | #338 | Tragic 30.3% |