Navajo vs Tohono O'odham Median Household Income
COMPARE
Navajo
Tohono O'odham
Median Household Income
Median Household Income Comparison
Navajo
Tohono O'odham
$59,159
MEDIAN HOUSEHOLD INCOME
0.0/ 100
METRIC RATING
346th/ 347
METRIC RANK
$61,663
MEDIAN HOUSEHOLD INCOME
0.0/ 100
METRIC RATING
344th/ 347
METRIC RANK
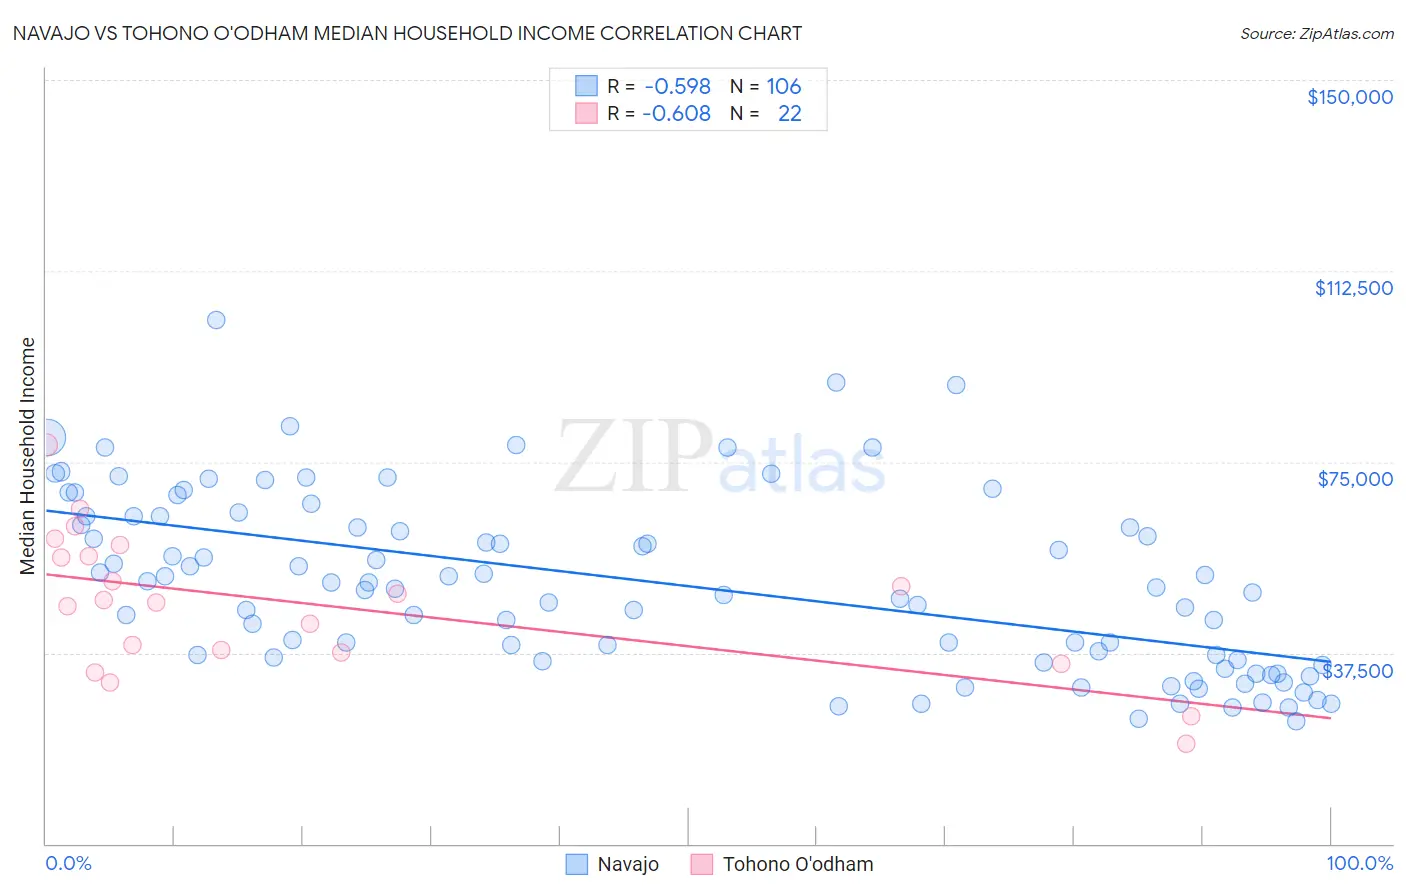
Navajo vs Tohono O'odham Median Household Income Correlation Chart
The statistical analysis conducted on geographies consisting of 224,715,573 people shows a substantial negative correlation between the proportion of Navajo and median household income in the United States with a correlation coefficient (R) of -0.598 and weighted average of $59,159. Similarly, the statistical analysis conducted on geographies consisting of 58,714,823 people shows a significant negative correlation between the proportion of Tohono O'odham and median household income in the United States with a correlation coefficient (R) of -0.608 and weighted average of $61,663, a difference of 4.2%.
Median Household Income Correlation Summary
| Measurement | Navajo | Tohono O'odham |
| Minimum | $24,004 | $19,643 |
| Maximum | $102,885 | $78,331 |
| Range | $78,881 | $58,688 |
| Mean | $51,106 | $47,012 |
| Median | $50,167 | $47,638 |
| Interquartile 25% (IQ1) | $36,185 | $37,566 |
| Interquartile 75% (IQ3) | $64,286 | $56,538 |
| Interquartile Range (IQR) | $28,101 | $18,972 |
| Standard Deviation (Sample) | $17,310 | $13,995 |
| Standard Deviation (Population) | $17,228 | $13,673 |
Demographics Similar to Navajo and Tohono O'odham by Median Household Income
In terms of median household income, the demographic groups most similar to Navajo are Puerto Rican ($59,197, a difference of 0.060%), Houma ($62,575, a difference of 5.8%), Pima ($63,262, a difference of 6.9%), Crow ($63,681, a difference of 7.6%), and Lumbee ($54,644, a difference of 8.3%). Similarly, the demographic groups most similar to Tohono O'odham are Houma ($62,575, a difference of 1.5%), Pima ($63,262, a difference of 2.6%), Crow ($63,681, a difference of 3.3%), Puerto Rican ($59,197, a difference of 4.2%), and Pueblo ($64,692, a difference of 4.9%).
| Demographics | Rating | Rank | Median Household Income |
| Menominee | 0.0 /100 | #328 | Tragic $68,423 |
| Dutch West Indians | 0.0 /100 | #329 | Tragic $68,412 |
| Arapaho | 0.0 /100 | #330 | Tragic $67,965 |
| Natives/Alaskans | 0.0 /100 | #331 | Tragic $67,879 |
| Sioux | 0.0 /100 | #332 | Tragic $67,792 |
| Creek | 0.0 /100 | #333 | Tragic $67,715 |
| Blacks/African Americans | 0.0 /100 | #334 | Tragic $67,573 |
| Cheyenne | 0.0 /100 | #335 | Tragic $66,974 |
| Immigrants | Congo | 0.0 /100 | #336 | Tragic $66,768 |
| Kiowa | 0.0 /100 | #337 | Tragic $65,914 |
| Immigrants | Yemen | 0.0 /100 | #338 | Tragic $65,194 |
| Hopi | 0.0 /100 | #339 | Tragic $65,043 |
| Pueblo | 0.0 /100 | #340 | Tragic $64,692 |
| Crow | 0.0 /100 | #341 | Tragic $63,681 |
| Pima | 0.0 /100 | #342 | Tragic $63,262 |
| Houma | 0.0 /100 | #343 | Tragic $62,575 |
| Tohono O'odham | 0.0 /100 | #344 | Tragic $61,663 |
| Puerto Ricans | 0.0 /100 | #345 | Tragic $59,197 |
| Navajo | 0.0 /100 | #346 | Tragic $59,159 |
| Lumbee | 0.0 /100 | #347 | Tragic $54,644 |