Yugoslavian vs Tohono O'odham Single Mother Poverty
COMPARE
Yugoslavian
Tohono O'odham
Single Mother Poverty
Single Mother Poverty Comparison
Yugoslavians
Tohono O'odham
29.4%
SINGLE MOTHER POVERTY
36.0/ 100
METRIC RATING
186th/ 347
METRIC RANK
43.0%
SINGLE MOTHER POVERTY
0.0/ 100
METRIC RATING
344th/ 347
METRIC RANK
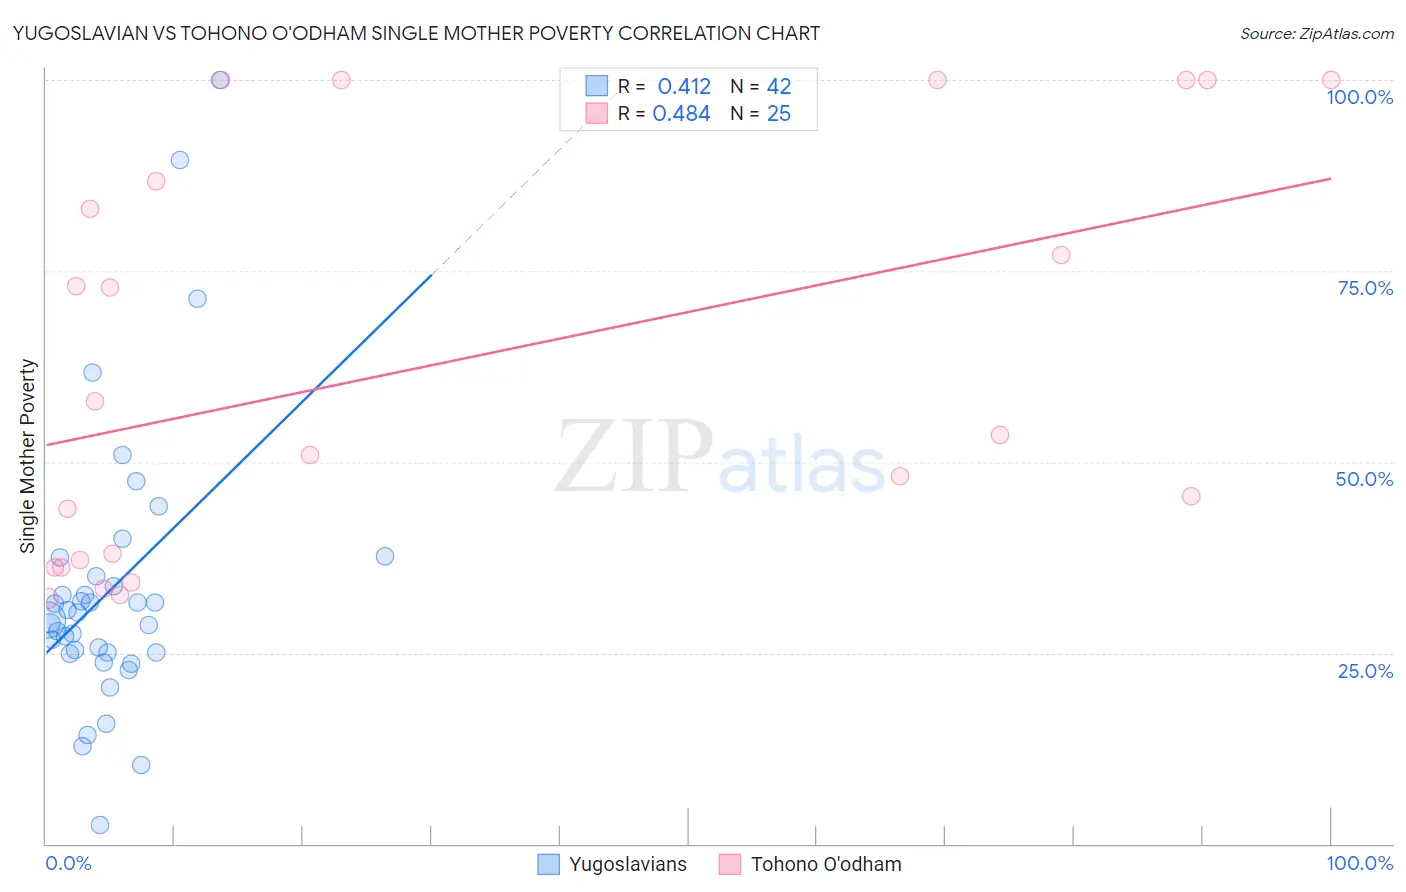
Yugoslavian vs Tohono O'odham Single Mother Poverty Correlation Chart
The statistical analysis conducted on geographies consisting of 280,794,338 people shows a moderate positive correlation between the proportion of Yugoslavians and poverty level among single mothers in the United States with a correlation coefficient (R) of 0.412 and weighted average of 29.4%. Similarly, the statistical analysis conducted on geographies consisting of 58,556,531 people shows a moderate positive correlation between the proportion of Tohono O'odham and poverty level among single mothers in the United States with a correlation coefficient (R) of 0.484 and weighted average of 43.0%, a difference of 46.6%.
Single Mother Poverty Correlation Summary
| Measurement | Yugoslavian | Tohono O'odham |
| Minimum | 2.5% | 32.1% |
| Maximum | 100.0% | 100.0% |
| Range | 97.5% | 67.9% |
| Mean | 33.4% | 62.9% |
| Median | 29.7% | 53.5% |
| Interquartile 25% (IQ1) | 25.0% | 36.6% |
| Interquartile 75% (IQ3) | 35.0% | 93.4% |
| Interquartile Range (IQR) | 10.0% | 56.8% |
| Standard Deviation (Sample) | 18.6% | 26.7% |
| Standard Deviation (Population) | 18.4% | 26.1% |
Similar Demographics by Single Mother Poverty
Demographics Similar to Yugoslavians by Single Mother Poverty
In terms of single mother poverty, the demographic groups most similar to Yugoslavians are Ghanaian (29.4%, a difference of 0.040%), Nigerian (29.3%, a difference of 0.10%), Nepalese (29.3%, a difference of 0.11%), Immigrants from Eastern Africa (29.3%, a difference of 0.13%), and Lebanese (29.4%, a difference of 0.19%).
| Demographics | Rating | Rank | Single Mother Poverty |
| Immigrants | Uzbekistan | 42.6 /100 | #179 | Average 29.3% |
| Immigrants | Norway | 41.5 /100 | #180 | Average 29.3% |
| Canadians | 40.4 /100 | #181 | Average 29.3% |
| Immigrants | Eastern Africa | 38.5 /100 | #182 | Fair 29.3% |
| Nepalese | 38.3 /100 | #183 | Fair 29.3% |
| Nigerians | 38.0 /100 | #184 | Fair 29.3% |
| Ghanaians | 36.8 /100 | #185 | Fair 29.4% |
| Yugoslavians | 36.0 /100 | #186 | Fair 29.4% |
| Lebanese | 32.5 /100 | #187 | Fair 29.4% |
| Guamanians/Chamorros | 31.8 /100 | #188 | Fair 29.4% |
| Immigrants | Africa | 31.6 /100 | #189 | Fair 29.4% |
| Immigrants | Germany | 30.4 /100 | #190 | Fair 29.5% |
| Immigrants | Trinidad and Tobago | 29.2 /100 | #191 | Fair 29.5% |
| Moroccans | 28.6 /100 | #192 | Fair 29.5% |
| Basques | 28.3 /100 | #193 | Fair 29.5% |
Demographics Similar to Tohono O'odham by Single Mother Poverty
In terms of single mother poverty, the demographic groups most similar to Tohono O'odham are Lumbee (43.2%, a difference of 0.49%), Houma (43.5%, a difference of 1.1%), Puerto Rican (44.5%, a difference of 3.5%), Cajun (40.3%, a difference of 6.7%), and Navajo (40.2%, a difference of 7.0%).
| Demographics | Rating | Rank | Single Mother Poverty |
| Menominee | 0.0 /100 | #333 | Tragic 37.1% |
| Pueblo | 0.0 /100 | #334 | Tragic 37.2% |
| Yuman | 0.0 /100 | #335 | Tragic 37.8% |
| Cheyenne | 0.0 /100 | #336 | Tragic 38.5% |
| Immigrants | Yemen | 0.0 /100 | #337 | Tragic 38.5% |
| Pima | 0.0 /100 | #338 | Tragic 38.6% |
| Crow | 0.0 /100 | #339 | Tragic 38.6% |
| Sioux | 0.0 /100 | #340 | Tragic 38.8% |
| Colville | 0.0 /100 | #341 | Tragic 39.3% |
| Navajo | 0.0 /100 | #342 | Tragic 40.2% |
| Cajuns | 0.0 /100 | #343 | Tragic 40.3% |
| Tohono O'odham | 0.0 /100 | #344 | Tragic 43.0% |
| Lumbee | 0.0 /100 | #345 | Tragic 43.2% |
| Houma | 0.0 /100 | #346 | Tragic 43.5% |
| Puerto Ricans | 0.0 /100 | #347 | Tragic 44.5% |