Moroccan vs Delaware Single Mother Poverty
COMPARE
Moroccan
Delaware
Single Mother Poverty
Single Mother Poverty Comparison
Moroccans
Delaware
29.5%
SINGLE MOTHER POVERTY
28.6/ 100
METRIC RATING
192nd/ 347
METRIC RANK
31.8%
SINGLE MOTHER POVERTY
0.0/ 100
METRIC RATING
276th/ 347
METRIC RANK
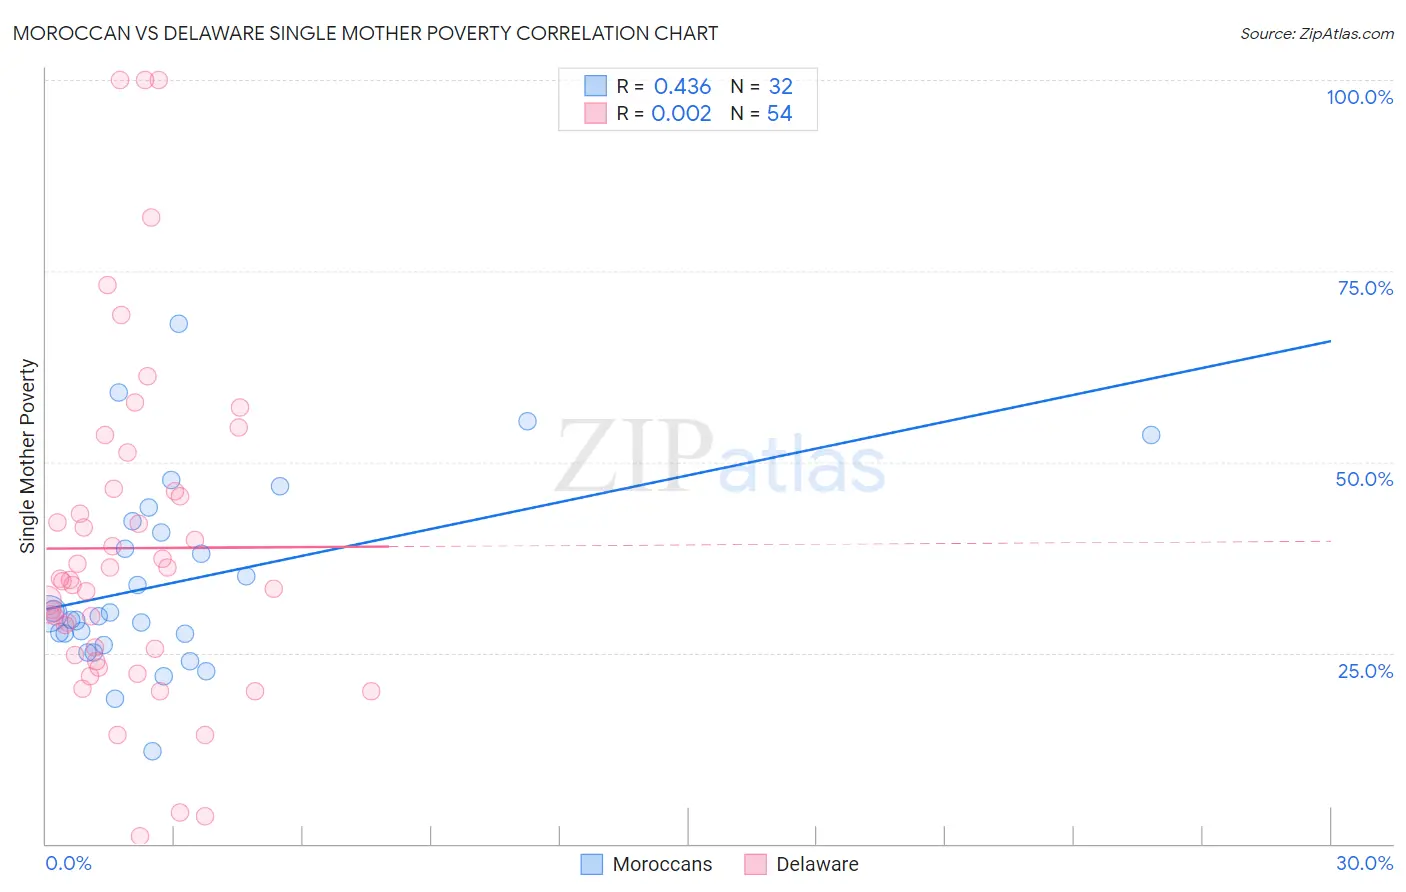
Moroccan vs Delaware Single Mother Poverty Correlation Chart
The statistical analysis conducted on geographies consisting of 199,317,261 people shows a moderate positive correlation between the proportion of Moroccans and poverty level among single mothers in the United States with a correlation coefficient (R) of 0.436 and weighted average of 29.5%. Similarly, the statistical analysis conducted on geographies consisting of 95,376,359 people shows no correlation between the proportion of Delaware and poverty level among single mothers in the United States with a correlation coefficient (R) of 0.002 and weighted average of 31.8%, a difference of 8.0%.
Single Mother Poverty Correlation Summary
| Measurement | Moroccan | Delaware |
| Minimum | 12.2% | 1.1% |
| Maximum | 68.0% | 100.0% |
| Range | 55.9% | 98.9% |
| Mean | 34.3% | 38.7% |
| Median | 30.0% | 34.5% |
| Interquartile 25% (IQ1) | 26.7% | 24.8% |
| Interquartile 75% (IQ3) | 41.5% | 46.2% |
| Interquartile Range (IQR) | 14.8% | 21.4% |
| Standard Deviation (Sample) | 12.5% | 22.2% |
| Standard Deviation (Population) | 12.3% | 21.9% |
Similar Demographics by Single Mother Poverty
Demographics Similar to Moroccans by Single Mother Poverty
In terms of single mother poverty, the demographic groups most similar to Moroccans are Basque (29.5%, a difference of 0.020%), Immigrants from Trinidad and Tobago (29.5%, a difference of 0.030%), Immigrants from Germany (29.5%, a difference of 0.10%), Icelander (29.5%, a difference of 0.15%), and Immigrants from Africa (29.4%, a difference of 0.17%).
| Demographics | Rating | Rank | Single Mother Poverty |
| Ghanaians | 36.8 /100 | #185 | Fair 29.4% |
| Yugoslavians | 36.0 /100 | #186 | Fair 29.4% |
| Lebanese | 32.5 /100 | #187 | Fair 29.4% |
| Guamanians/Chamorros | 31.8 /100 | #188 | Fair 29.4% |
| Immigrants | Africa | 31.6 /100 | #189 | Fair 29.4% |
| Immigrants | Germany | 30.4 /100 | #190 | Fair 29.5% |
| Immigrants | Trinidad and Tobago | 29.2 /100 | #191 | Fair 29.5% |
| Moroccans | 28.6 /100 | #192 | Fair 29.5% |
| Basques | 28.3 /100 | #193 | Fair 29.5% |
| Icelanders | 26.1 /100 | #194 | Fair 29.5% |
| Slavs | 24.5 /100 | #195 | Fair 29.6% |
| Spanish American Indians | 23.4 /100 | #196 | Fair 29.6% |
| Immigrants | Jamaica | 22.0 /100 | #197 | Fair 29.6% |
| Trinidadians and Tobagonians | 21.7 /100 | #198 | Fair 29.6% |
| Cubans | 20.8 /100 | #199 | Fair 29.6% |
Demographics Similar to Delaware by Single Mother Poverty
In terms of single mother poverty, the demographic groups most similar to Delaware are Central American (31.8%, a difference of 0.16%), Mexican American Indian (31.9%, a difference of 0.21%), Bangladeshi (31.7%, a difference of 0.35%), Immigrants from Zaire (32.0%, a difference of 0.43%), and Fijian (31.6%, a difference of 0.58%).
| Demographics | Rating | Rank | Single Mother Poverty |
| Scotch-Irish | 0.1 /100 | #269 | Tragic 31.5% |
| British West Indians | 0.1 /100 | #270 | Tragic 31.5% |
| Immigrants | Cabo Verde | 0.1 /100 | #271 | Tragic 31.6% |
| Immigrants | Micronesia | 0.1 /100 | #272 | Tragic 31.6% |
| Fijians | 0.1 /100 | #273 | Tragic 31.6% |
| Bangladeshis | 0.1 /100 | #274 | Tragic 31.7% |
| Central Americans | 0.1 /100 | #275 | Tragic 31.8% |
| Delaware | 0.0 /100 | #276 | Tragic 31.8% |
| Mexican American Indians | 0.0 /100 | #277 | Tragic 31.9% |
| Immigrants | Zaire | 0.0 /100 | #278 | Tragic 32.0% |
| Marshallese | 0.0 /100 | #279 | Tragic 32.1% |
| Immigrants | Nonimmigrants | 0.0 /100 | #280 | Tragic 32.2% |
| Cree | 0.0 /100 | #281 | Tragic 32.2% |
| Immigrants | Azores | 0.0 /100 | #282 | Tragic 32.2% |
| Spanish Americans | 0.0 /100 | #283 | Tragic 32.3% |