Moroccan vs Comanche Doctorate Degree
COMPARE
Moroccan
Comanche
Doctorate Degree
Doctorate Degree Comparison
Moroccans
Comanche
2.0%
DOCTORATE DEGREE
93.0/ 100
METRIC RATING
125th/ 347
METRIC RANK
1.6%
DOCTORATE DEGREE
1.8/ 100
METRIC RATING
247th/ 347
METRIC RANK
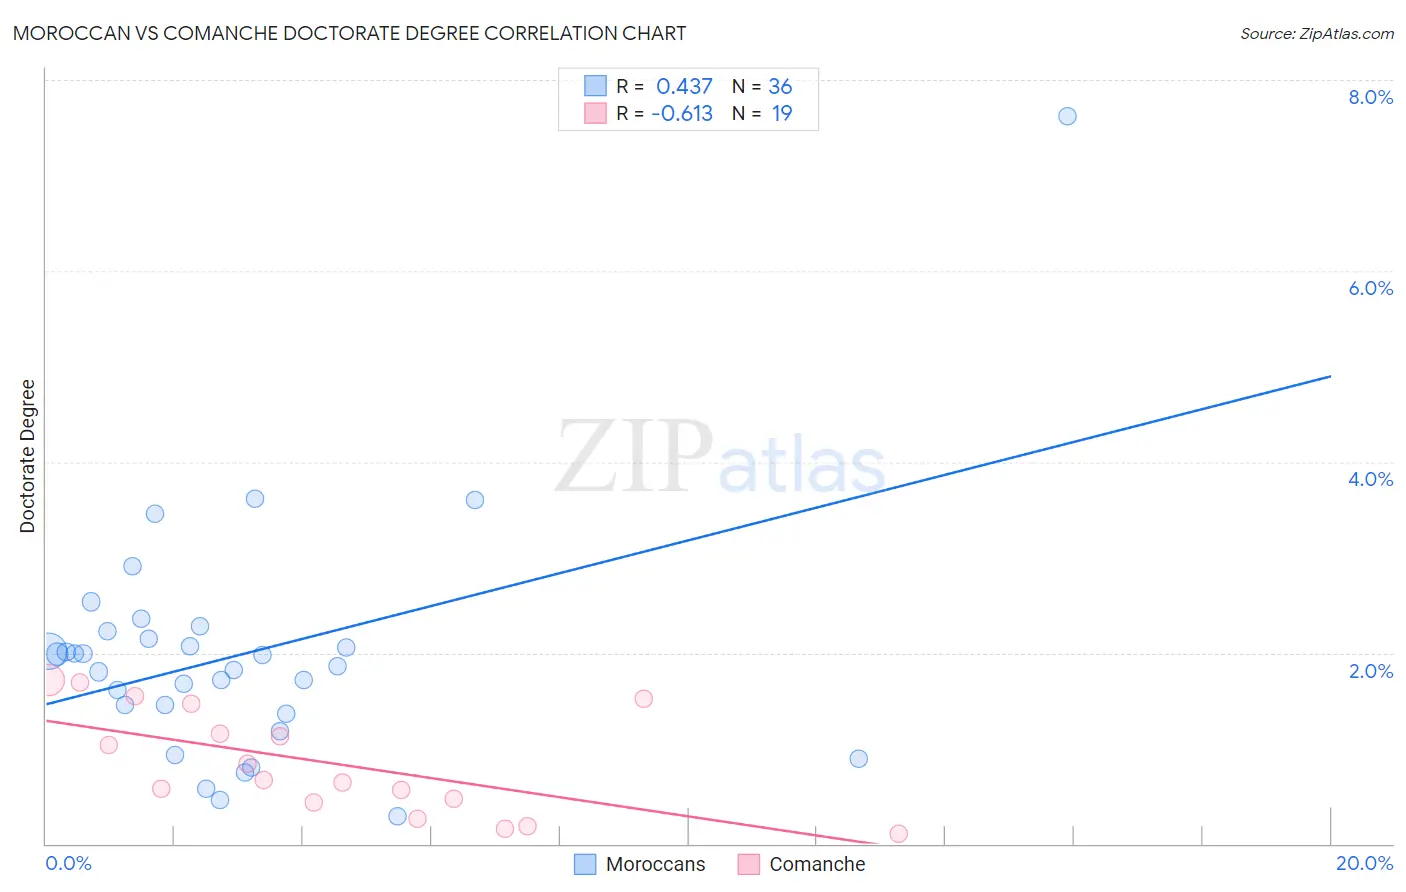
Moroccan vs Comanche Doctorate Degree Correlation Chart
The statistical analysis conducted on geographies consisting of 201,333,401 people shows a moderate positive correlation between the proportion of Moroccans and percentage of population with at least doctorate degree education in the United States with a correlation coefficient (R) of 0.437 and weighted average of 2.0%. Similarly, the statistical analysis conducted on geographies consisting of 108,720,636 people shows a significant negative correlation between the proportion of Comanche and percentage of population with at least doctorate degree education in the United States with a correlation coefficient (R) of -0.613 and weighted average of 1.6%, a difference of 28.2%.
Doctorate Degree Correlation Summary
| Measurement | Moroccan | Comanche |
| Minimum | 0.29% | 0.10% |
| Maximum | 7.6% | 1.7% |
| Range | 7.3% | 1.6% |
| Mean | 2.0% | 0.85% |
| Median | 1.9% | 0.67% |
| Interquartile 25% (IQ1) | 1.4% | 0.43% |
| Interquartile 75% (IQ3) | 2.2% | 1.5% |
| Interquartile Range (IQR) | 0.79% | 1.0% |
| Standard Deviation (Sample) | 1.3% | 0.54% |
| Standard Deviation (Population) | 1.2% | 0.53% |
Similar Demographics by Doctorate Degree
Demographics Similar to Moroccans by Doctorate Degree
In terms of doctorate degree, the demographic groups most similar to Moroccans are Ute (2.0%, a difference of 0.11%), Jordanian (2.0%, a difference of 0.42%), Palestinian (2.0%, a difference of 0.45%), Croatian (2.0%, a difference of 0.58%), and Immigrants from Zaire (2.0%, a difference of 0.87%).
| Demographics | Rating | Rank | Doctorate Degree |
| Icelanders | 96.0 /100 | #118 | Exceptional 2.1% |
| Pakistanis | 95.8 /100 | #119 | Exceptional 2.0% |
| Immigrants | Morocco | 95.5 /100 | #120 | Exceptional 2.0% |
| Immigrants | Jordan | 94.8 /100 | #121 | Exceptional 2.0% |
| Immigrants | Southern Europe | 94.7 /100 | #122 | Exceptional 2.0% |
| Croatians | 94.0 /100 | #123 | Exceptional 2.0% |
| Ute | 93.2 /100 | #124 | Exceptional 2.0% |
| Moroccans | 93.0 /100 | #125 | Exceptional 2.0% |
| Jordanians | 92.1 /100 | #126 | Exceptional 2.0% |
| Palestinians | 92.0 /100 | #127 | Exceptional 2.0% |
| Immigrants | Zaire | 91.1 /100 | #128 | Exceptional 2.0% |
| Canadians | 90.6 /100 | #129 | Exceptional 2.0% |
| Immigrants | Ukraine | 90.5 /100 | #130 | Exceptional 2.0% |
| Immigrants | Sierra Leone | 90.2 /100 | #131 | Exceptional 2.0% |
| Scottish | 89.4 /100 | #132 | Excellent 2.0% |
Demographics Similar to Comanche by Doctorate Degree
In terms of doctorate degree, the demographic groups most similar to Comanche are Hmong (1.6%, a difference of 0.020%), Delaware (1.6%, a difference of 0.12%), African (1.6%, a difference of 0.12%), French American Indian (1.6%, a difference of 0.49%), and Potawatomi (1.6%, a difference of 0.59%).
| Demographics | Rating | Rank | Doctorate Degree |
| Immigrants | Panama | 2.4 /100 | #240 | Tragic 1.6% |
| Cheyenne | 2.3 /100 | #241 | Tragic 1.6% |
| Ottawa | 2.2 /100 | #242 | Tragic 1.6% |
| Native Hawaiians | 2.1 /100 | #243 | Tragic 1.6% |
| French American Indians | 2.0 /100 | #244 | Tragic 1.6% |
| Delaware | 1.9 /100 | #245 | Tragic 1.6% |
| Hmong | 1.8 /100 | #246 | Tragic 1.6% |
| Comanche | 1.8 /100 | #247 | Tragic 1.6% |
| Africans | 1.8 /100 | #248 | Tragic 1.6% |
| Potawatomi | 1.6 /100 | #249 | Tragic 1.6% |
| Immigrants | Fiji | 1.6 /100 | #250 | Tragic 1.6% |
| Apache | 1.3 /100 | #251 | Tragic 1.5% |
| Yuman | 1.1 /100 | #252 | Tragic 1.5% |
| Americans | 1.0 /100 | #253 | Tragic 1.5% |
| Immigrants | Cambodia | 1.0 /100 | #254 | Tragic 1.5% |