Moroccan vs Immigrants from Caribbean Single Mother Poverty
COMPARE
Moroccan
Immigrants from Caribbean
Single Mother Poverty
Single Mother Poverty Comparison
Moroccans
Immigrants from Caribbean
29.5%
SINGLE MOTHER POVERTY
28.6/ 100
METRIC RATING
192nd/ 347
METRIC RANK
31.1%
SINGLE MOTHER POVERTY
0.4/ 100
METRIC RATING
258th/ 347
METRIC RANK
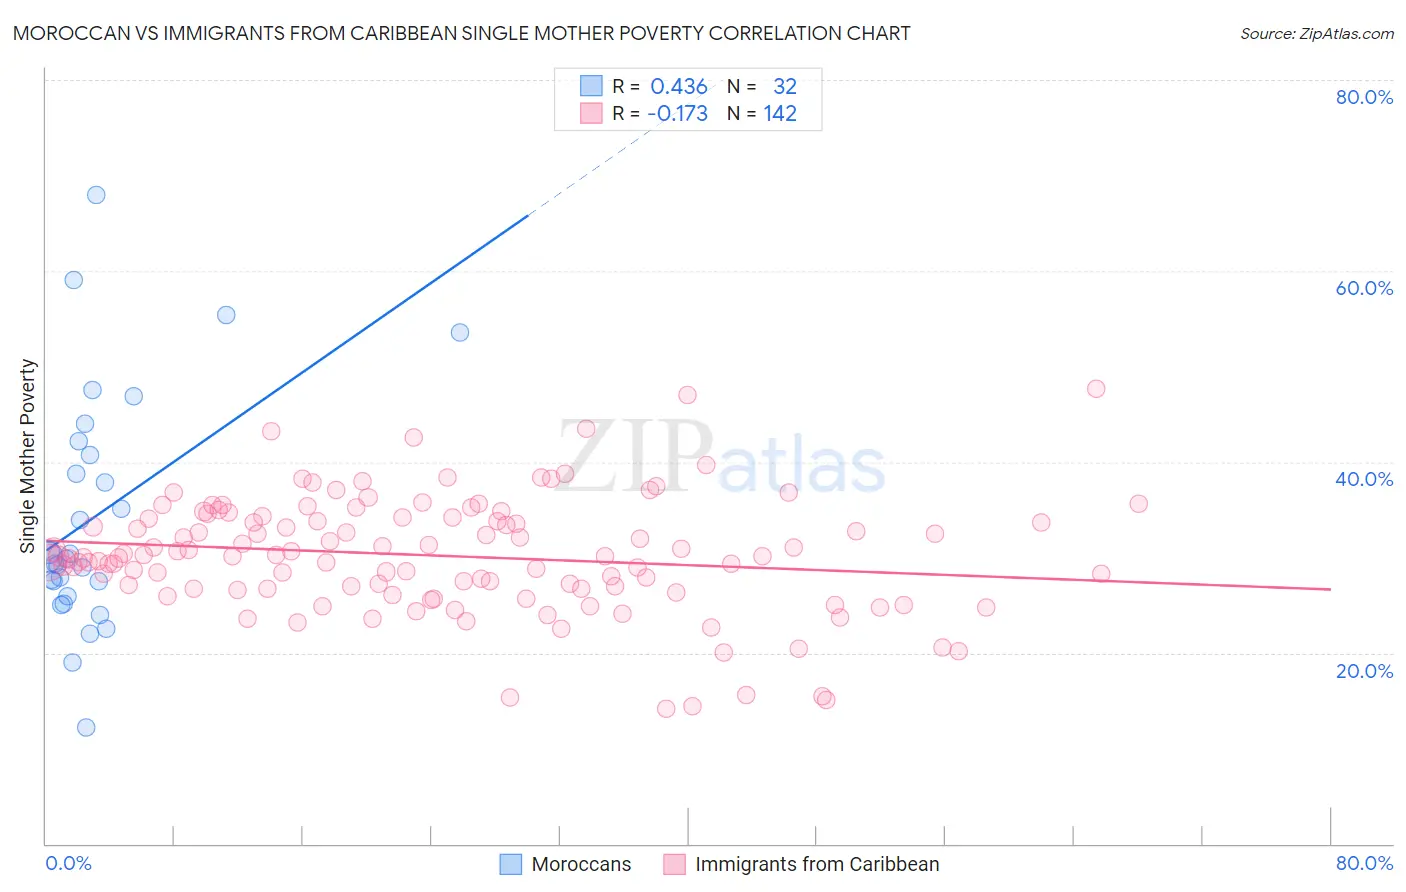
Moroccan vs Immigrants from Caribbean Single Mother Poverty Correlation Chart
The statistical analysis conducted on geographies consisting of 199,317,261 people shows a moderate positive correlation between the proportion of Moroccans and poverty level among single mothers in the United States with a correlation coefficient (R) of 0.436 and weighted average of 29.5%. Similarly, the statistical analysis conducted on geographies consisting of 437,361,394 people shows a poor negative correlation between the proportion of Immigrants from Caribbean and poverty level among single mothers in the United States with a correlation coefficient (R) of -0.173 and weighted average of 31.1%, a difference of 5.6%.
Single Mother Poverty Correlation Summary
| Measurement | Moroccan | Immigrants from Caribbean |
| Minimum | 12.2% | 14.1% |
| Maximum | 68.0% | 47.6% |
| Range | 55.9% | 33.5% |
| Mean | 34.3% | 30.2% |
| Median | 30.0% | 30.1% |
| Interquartile 25% (IQ1) | 26.7% | 26.7% |
| Interquartile 75% (IQ3) | 41.5% | 34.2% |
| Interquartile Range (IQR) | 14.8% | 7.4% |
| Standard Deviation (Sample) | 12.5% | 6.1% |
| Standard Deviation (Population) | 12.3% | 6.0% |
Similar Demographics by Single Mother Poverty
Demographics Similar to Moroccans by Single Mother Poverty
In terms of single mother poverty, the demographic groups most similar to Moroccans are Basque (29.5%, a difference of 0.020%), Immigrants from Trinidad and Tobago (29.5%, a difference of 0.030%), Immigrants from Germany (29.5%, a difference of 0.10%), Icelander (29.5%, a difference of 0.15%), and Immigrants from Africa (29.4%, a difference of 0.17%).
| Demographics | Rating | Rank | Single Mother Poverty |
| Ghanaians | 36.8 /100 | #185 | Fair 29.4% |
| Yugoslavians | 36.0 /100 | #186 | Fair 29.4% |
| Lebanese | 32.5 /100 | #187 | Fair 29.4% |
| Guamanians/Chamorros | 31.8 /100 | #188 | Fair 29.4% |
| Immigrants | Africa | 31.6 /100 | #189 | Fair 29.4% |
| Immigrants | Germany | 30.4 /100 | #190 | Fair 29.5% |
| Immigrants | Trinidad and Tobago | 29.2 /100 | #191 | Fair 29.5% |
| Moroccans | 28.6 /100 | #192 | Fair 29.5% |
| Basques | 28.3 /100 | #193 | Fair 29.5% |
| Icelanders | 26.1 /100 | #194 | Fair 29.5% |
| Slavs | 24.5 /100 | #195 | Fair 29.6% |
| Spanish American Indians | 23.4 /100 | #196 | Fair 29.6% |
| Immigrants | Jamaica | 22.0 /100 | #197 | Fair 29.6% |
| Trinidadians and Tobagonians | 21.7 /100 | #198 | Fair 29.6% |
| Cubans | 20.8 /100 | #199 | Fair 29.6% |
Demographics Similar to Immigrants from Caribbean by Single Mother Poverty
In terms of single mother poverty, the demographic groups most similar to Immigrants from Caribbean are Immigrants from Bangladesh (31.1%, a difference of 0.030%), Immigrants from Bahamas (31.1%, a difference of 0.090%), Immigrants from West Indies (31.1%, a difference of 0.13%), White/Caucasian (31.2%, a difference of 0.19%), and Immigrants from El Salvador (31.2%, a difference of 0.27%).
| Demographics | Rating | Rank | Single Mother Poverty |
| Tlingit-Haida | 0.6 /100 | #251 | Tragic 30.9% |
| Alaska Natives | 0.6 /100 | #252 | Tragic 30.9% |
| Celtics | 0.6 /100 | #253 | Tragic 30.9% |
| Senegalese | 0.5 /100 | #254 | Tragic 31.0% |
| Belizeans | 0.5 /100 | #255 | Tragic 31.0% |
| Immigrants | West Indies | 0.4 /100 | #256 | Tragic 31.1% |
| Immigrants | Bahamas | 0.4 /100 | #257 | Tragic 31.1% |
| Immigrants | Caribbean | 0.4 /100 | #258 | Tragic 31.1% |
| Immigrants | Bangladesh | 0.4 /100 | #259 | Tragic 31.1% |
| Whites/Caucasians | 0.3 /100 | #260 | Tragic 31.2% |
| Immigrants | El Salvador | 0.3 /100 | #261 | Tragic 31.2% |
| Hmong | 0.3 /100 | #262 | Tragic 31.2% |
| Bahamians | 0.2 /100 | #263 | Tragic 31.3% |
| Immigrants | Ecuador | 0.2 /100 | #264 | Tragic 31.3% |
| German Russians | 0.2 /100 | #265 | Tragic 31.3% |