Moroccan vs Immigrants from Korea Single Mother Poverty
COMPARE
Moroccan
Immigrants from Korea
Single Mother Poverty
Single Mother Poverty Comparison
Moroccans
Immigrants from Korea
29.5%
SINGLE MOTHER POVERTY
28.6/ 100
METRIC RATING
192nd/ 347
METRIC RANK
26.2%
SINGLE MOTHER POVERTY
100.0/ 100
METRIC RATING
22nd/ 347
METRIC RANK
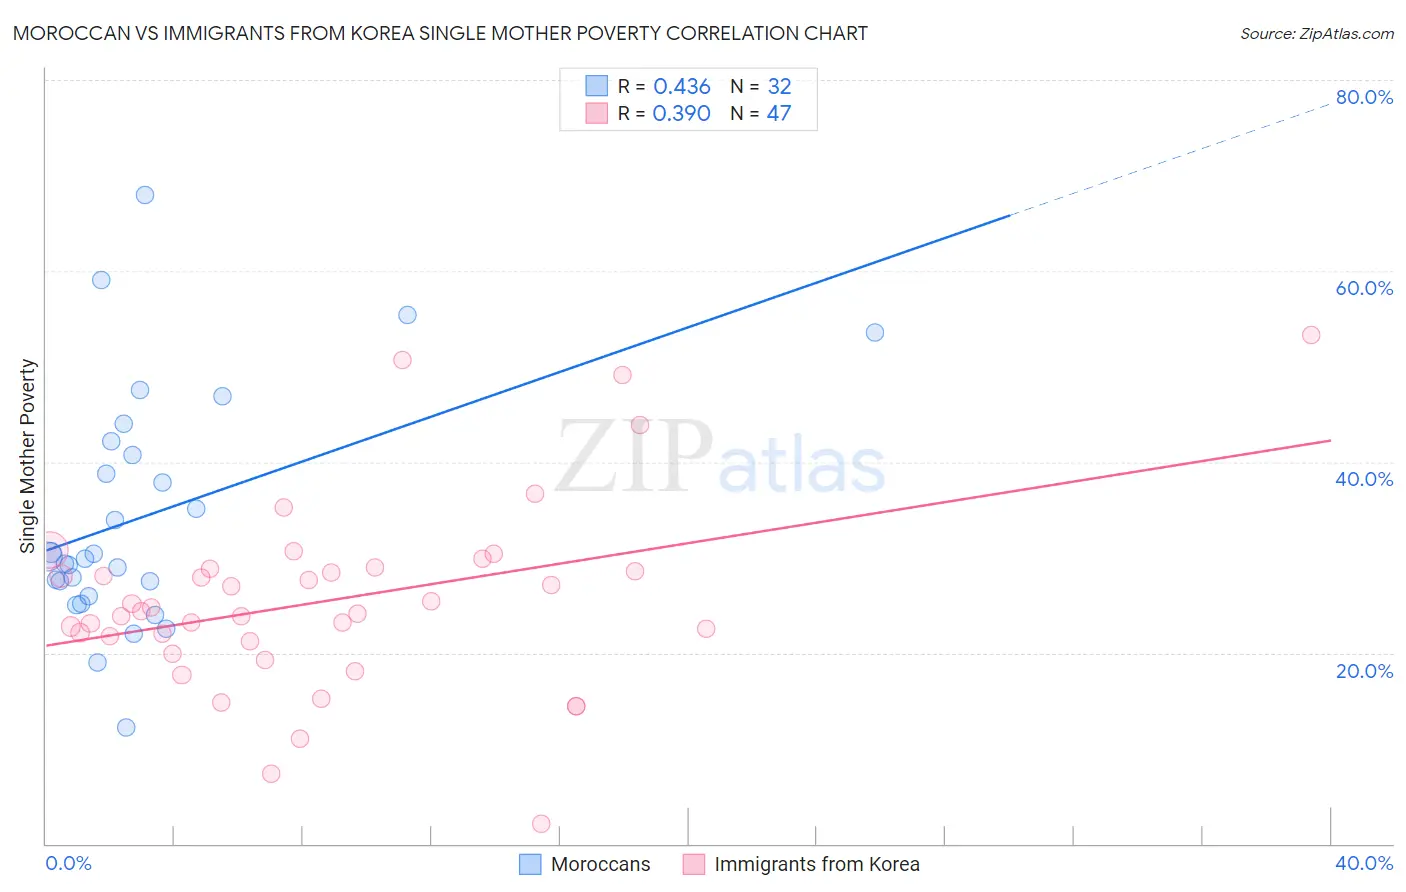
Moroccan vs Immigrants from Korea Single Mother Poverty Correlation Chart
The statistical analysis conducted on geographies consisting of 199,317,261 people shows a moderate positive correlation between the proportion of Moroccans and poverty level among single mothers in the United States with a correlation coefficient (R) of 0.436 and weighted average of 29.5%. Similarly, the statistical analysis conducted on geographies consisting of 404,112,179 people shows a mild positive correlation between the proportion of Immigrants from Korea and poverty level among single mothers in the United States with a correlation coefficient (R) of 0.390 and weighted average of 26.2%, a difference of 12.6%.
Single Mother Poverty Correlation Summary
| Measurement | Moroccan | Immigrants from Korea |
| Minimum | 12.2% | 2.1% |
| Maximum | 68.0% | 53.3% |
| Range | 55.9% | 51.2% |
| Mean | 34.3% | 25.5% |
| Median | 30.0% | 24.4% |
| Interquartile 25% (IQ1) | 26.7% | 21.2% |
| Interquartile 75% (IQ3) | 41.5% | 28.8% |
| Interquartile Range (IQR) | 14.8% | 7.5% |
| Standard Deviation (Sample) | 12.5% | 9.9% |
| Standard Deviation (Population) | 12.3% | 9.8% |
Similar Demographics by Single Mother Poverty
Demographics Similar to Moroccans by Single Mother Poverty
In terms of single mother poverty, the demographic groups most similar to Moroccans are Basque (29.5%, a difference of 0.020%), Immigrants from Trinidad and Tobago (29.5%, a difference of 0.030%), Immigrants from Germany (29.5%, a difference of 0.10%), Icelander (29.5%, a difference of 0.15%), and Immigrants from Africa (29.4%, a difference of 0.17%).
| Demographics | Rating | Rank | Single Mother Poverty |
| Ghanaians | 36.8 /100 | #185 | Fair 29.4% |
| Yugoslavians | 36.0 /100 | #186 | Fair 29.4% |
| Lebanese | 32.5 /100 | #187 | Fair 29.4% |
| Guamanians/Chamorros | 31.8 /100 | #188 | Fair 29.4% |
| Immigrants | Africa | 31.6 /100 | #189 | Fair 29.4% |
| Immigrants | Germany | 30.4 /100 | #190 | Fair 29.5% |
| Immigrants | Trinidad and Tobago | 29.2 /100 | #191 | Fair 29.5% |
| Moroccans | 28.6 /100 | #192 | Fair 29.5% |
| Basques | 28.3 /100 | #193 | Fair 29.5% |
| Icelanders | 26.1 /100 | #194 | Fair 29.5% |
| Slavs | 24.5 /100 | #195 | Fair 29.6% |
| Spanish American Indians | 23.4 /100 | #196 | Fair 29.6% |
| Immigrants | Jamaica | 22.0 /100 | #197 | Fair 29.6% |
| Trinidadians and Tobagonians | 21.7 /100 | #198 | Fair 29.6% |
| Cubans | 20.8 /100 | #199 | Fair 29.6% |
Demographics Similar to Immigrants from Korea by Single Mother Poverty
In terms of single mother poverty, the demographic groups most similar to Immigrants from Korea are Immigrants from Bolivia (26.2%, a difference of 0.17%), Burmese (26.2%, a difference of 0.17%), Immigrants from Moldova (26.2%, a difference of 0.20%), Immigrants from China (26.1%, a difference of 0.36%), and Immigrants from Asia (26.3%, a difference of 0.39%).
| Demographics | Rating | Rank | Single Mother Poverty |
| Immigrants | Ireland | 100.0 /100 | #15 | Exceptional 25.8% |
| Bolivians | 100.0 /100 | #16 | Exceptional 25.9% |
| Asians | 100.0 /100 | #17 | Exceptional 26.0% |
| Immigrants | Pakistan | 100.0 /100 | #18 | Exceptional 26.0% |
| Immigrants | Eastern Asia | 100.0 /100 | #19 | Exceptional 26.1% |
| Immigrants | China | 100.0 /100 | #20 | Exceptional 26.1% |
| Immigrants | Bolivia | 100.0 /100 | #21 | Exceptional 26.2% |
| Immigrants | Korea | 100.0 /100 | #22 | Exceptional 26.2% |
| Burmese | 100.0 /100 | #23 | Exceptional 26.2% |
| Immigrants | Moldova | 100.0 /100 | #24 | Exceptional 26.2% |
| Immigrants | Asia | 100.0 /100 | #25 | Exceptional 26.3% |
| Immigrants | Sri Lanka | 100.0 /100 | #26 | Exceptional 26.3% |
| Immigrants | Japan | 100.0 /100 | #27 | Exceptional 26.4% |
| Koreans | 100.0 /100 | #28 | Exceptional 26.4% |
| Jordanians | 100.0 /100 | #29 | Exceptional 26.4% |