Moroccan vs Immigrants from Morocco Single Mother Poverty
COMPARE
Moroccan
Immigrants from Morocco
Single Mother Poverty
Single Mother Poverty Comparison
Moroccans
Immigrants from Morocco
29.5%
SINGLE MOTHER POVERTY
28.6/ 100
METRIC RATING
192nd/ 347
METRIC RANK
28.4%
SINGLE MOTHER POVERTY
89.5/ 100
METRIC RATING
132nd/ 347
METRIC RANK
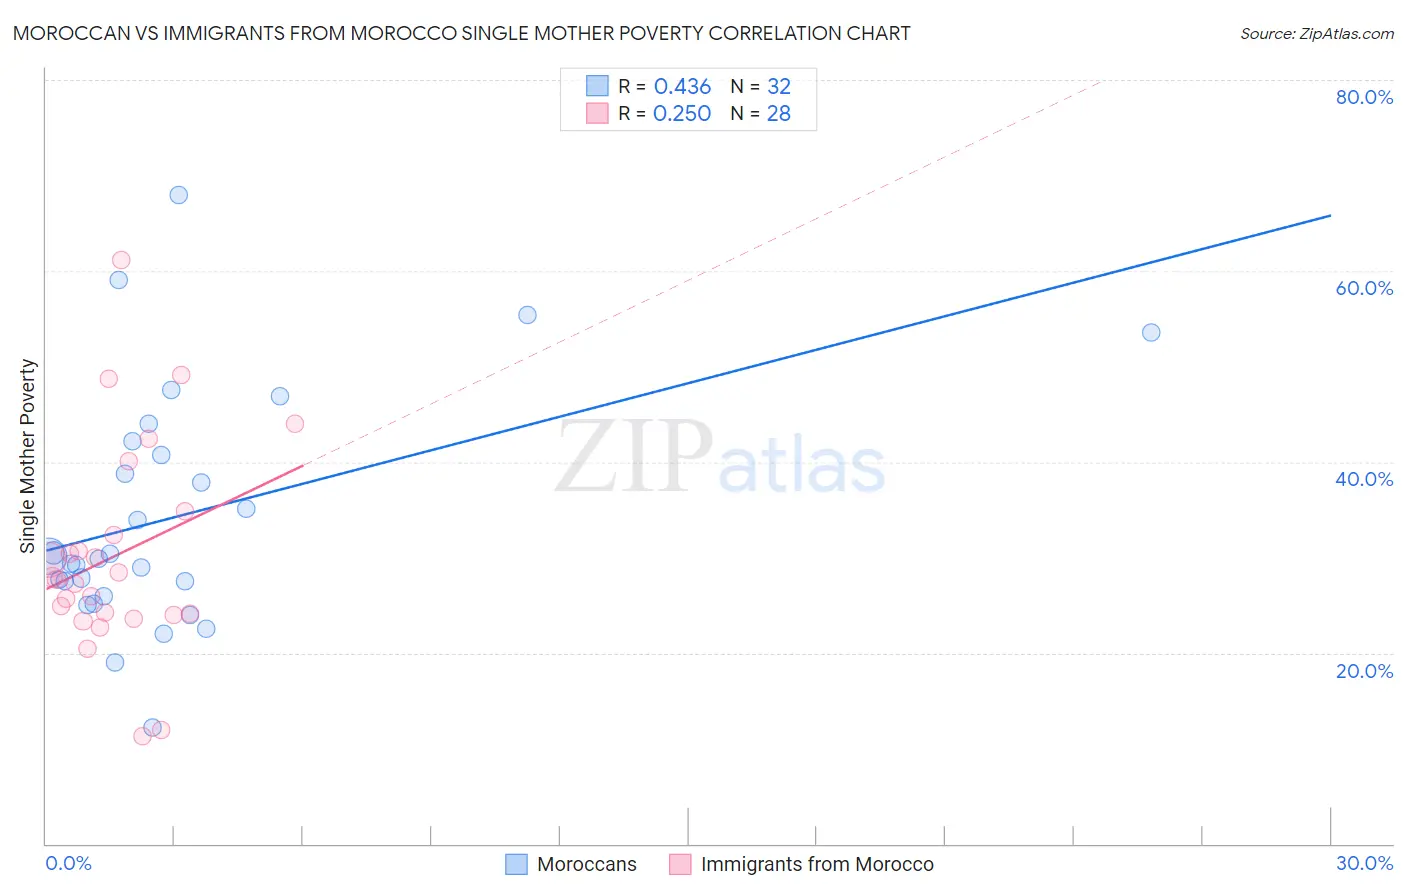
Moroccan vs Immigrants from Morocco Single Mother Poverty Correlation Chart
The statistical analysis conducted on geographies consisting of 199,317,261 people shows a moderate positive correlation between the proportion of Moroccans and poverty level among single mothers in the United States with a correlation coefficient (R) of 0.436 and weighted average of 29.5%. Similarly, the statistical analysis conducted on geographies consisting of 176,937,771 people shows a weak positive correlation between the proportion of Immigrants from Morocco and poverty level among single mothers in the United States with a correlation coefficient (R) of 0.250 and weighted average of 28.4%, a difference of 3.7%.
Single Mother Poverty Correlation Summary
| Measurement | Moroccan | Immigrants from Morocco |
| Minimum | 12.2% | 11.2% |
| Maximum | 68.0% | 61.2% |
| Range | 55.9% | 49.9% |
| Mean | 34.3% | 30.2% |
| Median | 30.0% | 27.8% |
| Interquartile 25% (IQ1) | 26.7% | 24.0% |
| Interquartile 75% (IQ3) | 41.5% | 33.6% |
| Interquartile Range (IQR) | 14.8% | 9.6% |
| Standard Deviation (Sample) | 12.5% | 11.0% |
| Standard Deviation (Population) | 12.3% | 10.8% |
Similar Demographics by Single Mother Poverty
Demographics Similar to Moroccans by Single Mother Poverty
In terms of single mother poverty, the demographic groups most similar to Moroccans are Basque (29.5%, a difference of 0.020%), Immigrants from Trinidad and Tobago (29.5%, a difference of 0.030%), Immigrants from Germany (29.5%, a difference of 0.10%), Icelander (29.5%, a difference of 0.15%), and Immigrants from Africa (29.4%, a difference of 0.17%).
| Demographics | Rating | Rank | Single Mother Poverty |
| Ghanaians | 36.8 /100 | #185 | Fair 29.4% |
| Yugoslavians | 36.0 /100 | #186 | Fair 29.4% |
| Lebanese | 32.5 /100 | #187 | Fair 29.4% |
| Guamanians/Chamorros | 31.8 /100 | #188 | Fair 29.4% |
| Immigrants | Africa | 31.6 /100 | #189 | Fair 29.4% |
| Immigrants | Germany | 30.4 /100 | #190 | Fair 29.5% |
| Immigrants | Trinidad and Tobago | 29.2 /100 | #191 | Fair 29.5% |
| Moroccans | 28.6 /100 | #192 | Fair 29.5% |
| Basques | 28.3 /100 | #193 | Fair 29.5% |
| Icelanders | 26.1 /100 | #194 | Fair 29.5% |
| Slavs | 24.5 /100 | #195 | Fair 29.6% |
| Spanish American Indians | 23.4 /100 | #196 | Fair 29.6% |
| Immigrants | Jamaica | 22.0 /100 | #197 | Fair 29.6% |
| Trinidadians and Tobagonians | 21.7 /100 | #198 | Fair 29.6% |
| Cubans | 20.8 /100 | #199 | Fair 29.6% |
Demographics Similar to Immigrants from Morocco by Single Mother Poverty
In terms of single mother poverty, the demographic groups most similar to Immigrants from Morocco are Swedish (28.4%, a difference of 0.0%), Immigrants from Southern Europe (28.4%, a difference of 0.030%), Immigrants from Spain (28.4%, a difference of 0.030%), Native Hawaiian (28.4%, a difference of 0.070%), and Immigrants from Canada (28.4%, a difference of 0.070%).
| Demographics | Rating | Rank | Single Mother Poverty |
| Kenyans | 90.9 /100 | #125 | Exceptional 28.4% |
| Immigrants | Chile | 90.8 /100 | #126 | Exceptional 28.4% |
| Poles | 90.8 /100 | #127 | Exceptional 28.4% |
| Immigrants | England | 90.5 /100 | #128 | Exceptional 28.4% |
| South Americans | 90.4 /100 | #129 | Exceptional 28.4% |
| Norwegians | 90.4 /100 | #130 | Exceptional 28.4% |
| Immigrants | Austria | 90.3 /100 | #131 | Exceptional 28.4% |
| Immigrants | Morocco | 89.5 /100 | #132 | Excellent 28.4% |
| Swedes | 89.4 /100 | #133 | Excellent 28.4% |
| Immigrants | Southern Europe | 89.2 /100 | #134 | Excellent 28.4% |
| Immigrants | Spain | 89.2 /100 | #135 | Excellent 28.4% |
| Native Hawaiians | 88.9 /100 | #136 | Excellent 28.4% |
| Immigrants | Canada | 88.9 /100 | #137 | Excellent 28.4% |
| Immigrants | Belgium | 88.5 /100 | #138 | Excellent 28.5% |
| Samoans | 88.1 /100 | #139 | Excellent 28.5% |