Mexican American Indian vs Immigrants from Western Asia Male Poverty
COMPARE
Mexican American Indian
Immigrants from Western Asia
Male Poverty
Male Poverty Comparison
Mexican American Indians
Immigrants from Western Asia
13.0%
MALE POVERTY
0.1/ 100
METRIC RATING
254th/ 347
METRIC RANK
11.8%
MALE POVERTY
9.8/ 100
METRIC RATING
203rd/ 347
METRIC RANK
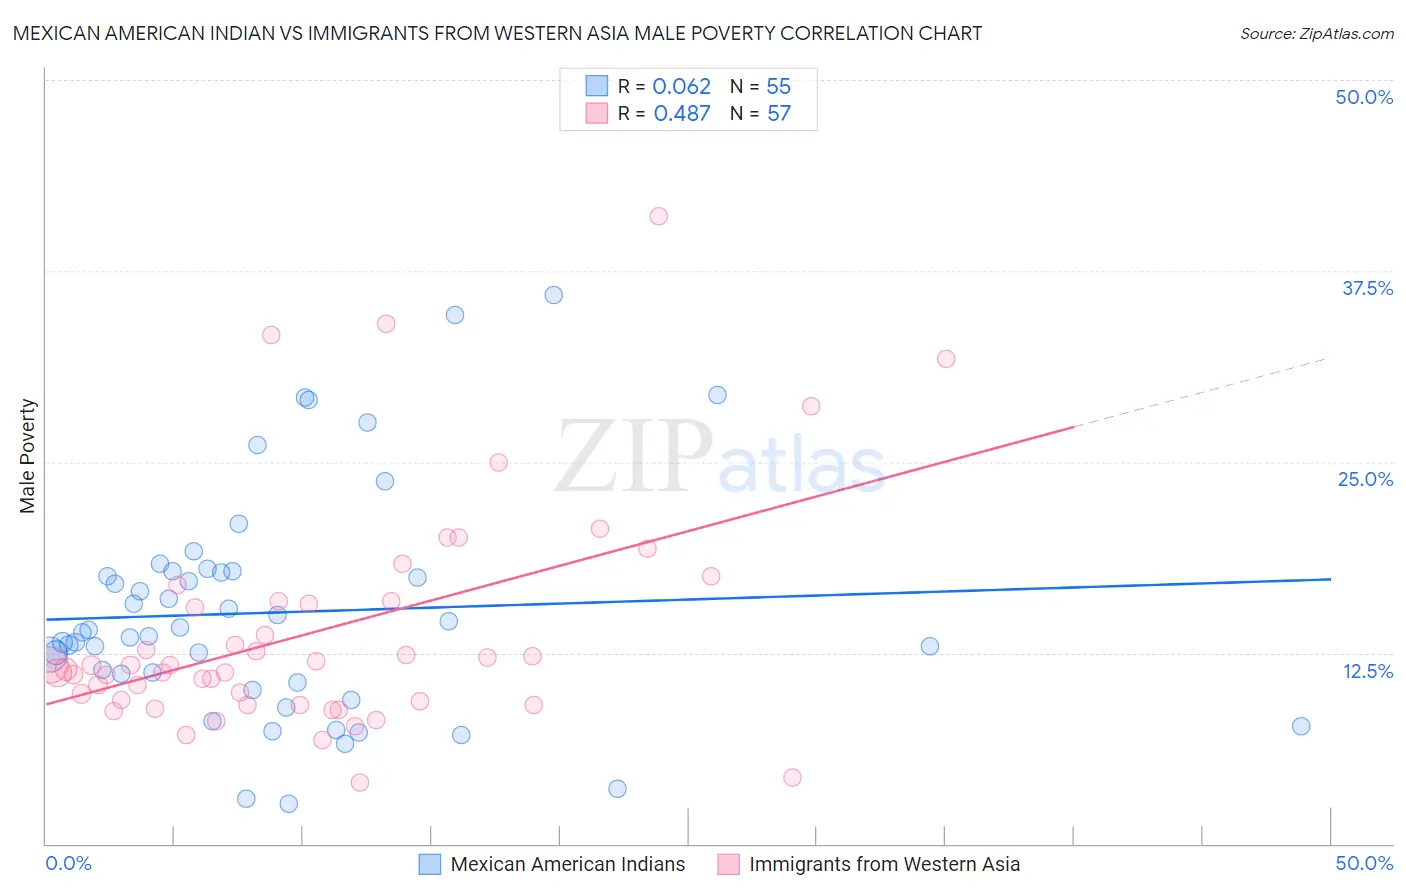
Mexican American Indian vs Immigrants from Western Asia Male Poverty Correlation Chart
The statistical analysis conducted on geographies consisting of 317,482,192 people shows a slight positive correlation between the proportion of Mexican American Indians and poverty level among males in the United States with a correlation coefficient (R) of 0.062 and weighted average of 13.0%. Similarly, the statistical analysis conducted on geographies consisting of 404,054,336 people shows a moderate positive correlation between the proportion of Immigrants from Western Asia and poverty level among males in the United States with a correlation coefficient (R) of 0.487 and weighted average of 11.8%, a difference of 10.1%.
Male Poverty Correlation Summary
| Measurement | Mexican American Indian | Immigrants from Western Asia |
| Minimum | 2.6% | 4.0% |
| Maximum | 35.9% | 41.1% |
| Range | 33.3% | 37.1% |
| Mean | 15.1% | 13.9% |
| Median | 13.8% | 11.7% |
| Interquartile 25% (IQ1) | 10.6% | 9.2% |
| Interquartile 75% (IQ3) | 17.8% | 15.9% |
| Interquartile Range (IQR) | 7.2% | 6.7% |
| Standard Deviation (Sample) | 7.4% | 7.5% |
| Standard Deviation (Population) | 7.3% | 7.4% |
Similar Demographics by Male Poverty
Demographics Similar to Mexican American Indians by Male Poverty
In terms of male poverty, the demographic groups most similar to Mexican American Indians are Immigrants from Liberia (13.0%, a difference of 0.090%), Immigrants from Burma/Myanmar (13.0%, a difference of 0.29%), Immigrants from Ghana (12.9%, a difference of 0.39%), Immigrants from Ecuador (12.9%, a difference of 0.44%), and Immigrants from Cuba (12.9%, a difference of 0.47%).
| Demographics | Rating | Rank | Male Poverty |
| Immigrants | Western Africa | 0.2 /100 | #247 | Tragic 12.9% |
| Immigrants | Sudan | 0.2 /100 | #248 | Tragic 12.9% |
| Potawatomi | 0.2 /100 | #249 | Tragic 12.9% |
| Immigrants | Nicaragua | 0.2 /100 | #250 | Tragic 12.9% |
| Immigrants | Cuba | 0.2 /100 | #251 | Tragic 12.9% |
| Immigrants | Ecuador | 0.2 /100 | #252 | Tragic 12.9% |
| Immigrants | Ghana | 0.2 /100 | #253 | Tragic 12.9% |
| Mexican American Indians | 0.1 /100 | #254 | Tragic 13.0% |
| Immigrants | Liberia | 0.1 /100 | #255 | Tragic 13.0% |
| Immigrants | Burma/Myanmar | 0.1 /100 | #256 | Tragic 13.0% |
| Immigrants | Trinidad and Tobago | 0.1 /100 | #257 | Tragic 13.1% |
| Cape Verdeans | 0.1 /100 | #258 | Tragic 13.1% |
| Cherokee | 0.1 /100 | #259 | Tragic 13.1% |
| Ottawa | 0.1 /100 | #260 | Tragic 13.1% |
| Trinidadians and Tobagonians | 0.1 /100 | #261 | Tragic 13.1% |
Demographics Similar to Immigrants from Western Asia by Male Poverty
In terms of male poverty, the demographic groups most similar to Immigrants from Western Asia are Aleut (11.8%, a difference of 0.14%), Immigrants from Uganda (11.8%, a difference of 0.36%), Spaniard (11.7%, a difference of 0.86%), Immigrants from Lebanon (11.7%, a difference of 0.87%), and Spanish (11.7%, a difference of 0.97%).
| Demographics | Rating | Rank | Male Poverty |
| Hmong | 15.8 /100 | #196 | Poor 11.6% |
| Delaware | 15.4 /100 | #197 | Poor 11.7% |
| Iraqis | 14.7 /100 | #198 | Poor 11.7% |
| Spanish | 14.1 /100 | #199 | Poor 11.7% |
| Immigrants | Lebanon | 13.6 /100 | #200 | Poor 11.7% |
| Spaniards | 13.5 /100 | #201 | Poor 11.7% |
| Aleuts | 10.4 /100 | #202 | Poor 11.8% |
| Immigrants | Western Asia | 9.8 /100 | #203 | Tragic 11.8% |
| Immigrants | Uganda | 8.5 /100 | #204 | Tragic 11.8% |
| Panamanians | 6.2 /100 | #205 | Tragic 11.9% |
| Immigrants | Eastern Africa | 5.4 /100 | #206 | Tragic 12.0% |
| Malaysians | 5.2 /100 | #207 | Tragic 12.0% |
| Immigrants | Immigrants | 4.5 /100 | #208 | Tragic 12.0% |
| Immigrants | Azores | 4.3 /100 | #209 | Tragic 12.0% |
| Moroccans | 4.2 /100 | #210 | Tragic 12.0% |