Menominee vs Belizean Single Female Poverty
COMPARE
Menominee
Belizean
Single Female Poverty
Single Female Poverty Comparison
Menominee
Belizeans
27.8%
SINGLE FEMALE POVERTY
0.0/ 100
METRIC RATING
329th/ 347
METRIC RANK
22.4%
SINGLE FEMALE POVERTY
1.4/ 100
METRIC RATING
248th/ 347
METRIC RANK
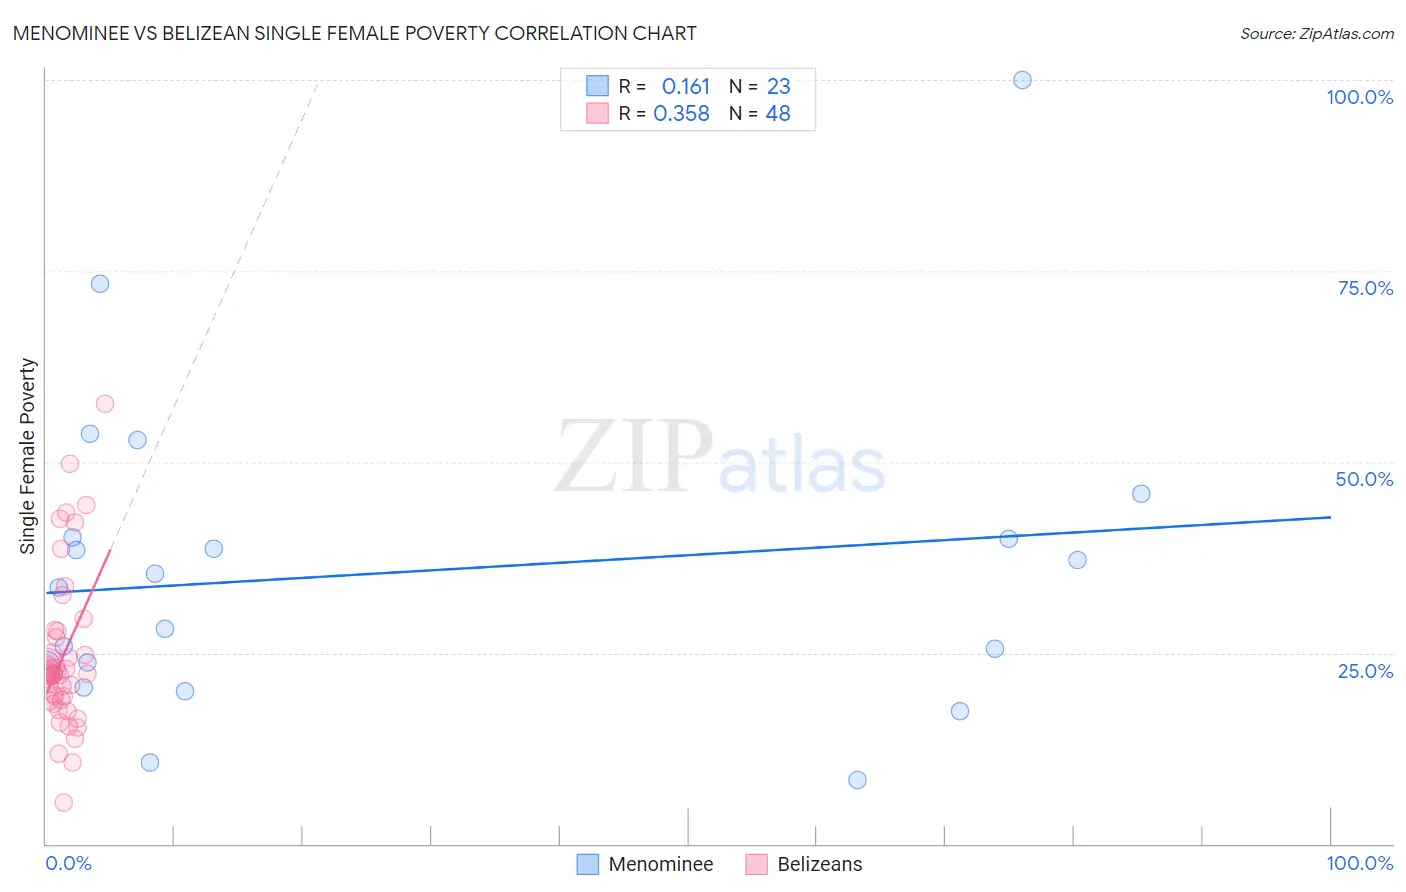
Menominee vs Belizean Single Female Poverty Correlation Chart
The statistical analysis conducted on geographies consisting of 45,620,212 people shows a poor positive correlation between the proportion of Menominee and poverty level among single females in the United States with a correlation coefficient (R) of 0.161 and weighted average of 27.8%. Similarly, the statistical analysis conducted on geographies consisting of 143,694,169 people shows a mild positive correlation between the proportion of Belizeans and poverty level among single females in the United States with a correlation coefficient (R) of 0.358 and weighted average of 22.4%, a difference of 24.2%.
Single Female Poverty Correlation Summary
| Measurement | Menominee | Belizean |
| Minimum | 8.3% | 5.4% |
| Maximum | 100.0% | 57.6% |
| Range | 91.7% | 52.3% |
| Mean | 35.4% | 24.6% |
| Median | 33.5% | 22.2% |
| Interquartile 25% (IQ1) | 22.3% | 18.7% |
| Interquartile 75% (IQ3) | 40.1% | 27.5% |
| Interquartile Range (IQR) | 17.8% | 8.8% |
| Standard Deviation (Sample) | 20.5% | 10.4% |
| Standard Deviation (Population) | 20.1% | 10.2% |
Similar Demographics by Single Female Poverty
Demographics Similar to Menominee by Single Female Poverty
In terms of single female poverty, the demographic groups most similar to Menominee are Apache (27.7%, a difference of 0.46%), Hopi (28.0%, a difference of 0.71%), Native/Alaskan (28.2%, a difference of 1.3%), Dutch West Indian (27.5%, a difference of 1.4%), and Creek (27.4%, a difference of 1.5%).
| Demographics | Rating | Rank | Single Female Poverty |
| Seminole | 0.0 /100 | #322 | Tragic 26.8% |
| Chippewa | 0.0 /100 | #323 | Tragic 26.8% |
| Kiowa | 0.0 /100 | #324 | Tragic 26.9% |
| Choctaw | 0.0 /100 | #325 | Tragic 27.2% |
| Creek | 0.0 /100 | #326 | Tragic 27.4% |
| Dutch West Indians | 0.0 /100 | #327 | Tragic 27.5% |
| Apache | 0.0 /100 | #328 | Tragic 27.7% |
| Menominee | 0.0 /100 | #329 | Tragic 27.8% |
| Hopi | 0.0 /100 | #330 | Tragic 28.0% |
| Natives/Alaskans | 0.0 /100 | #331 | Tragic 28.2% |
| Yakama | 0.0 /100 | #332 | Tragic 28.3% |
| Ute | 0.0 /100 | #333 | Tragic 28.4% |
| Pueblo | 0.0 /100 | #334 | Tragic 28.6% |
| Immigrants | Yemen | 0.0 /100 | #335 | Tragic 28.9% |
| Colville | 0.0 /100 | #336 | Tragic 29.1% |
Demographics Similar to Belizeans by Single Female Poverty
In terms of single female poverty, the demographic groups most similar to Belizeans are Immigrants from El Salvador (22.4%, a difference of 0.010%), Liberian (22.4%, a difference of 0.070%), Immigrants from Caribbean (22.4%, a difference of 0.10%), Immigrants from Bahamas (22.5%, a difference of 0.25%), and Immigrants from West Indies (22.5%, a difference of 0.39%).
| Demographics | Rating | Rank | Single Female Poverty |
| Cape Verdeans | 2.1 /100 | #241 | Tragic 22.3% |
| Bermudans | 2.0 /100 | #242 | Tragic 22.3% |
| West Indians | 1.9 /100 | #243 | Tragic 22.3% |
| Immigrants | Middle Africa | 1.9 /100 | #244 | Tragic 22.3% |
| Immigrants | Bangladesh | 1.8 /100 | #245 | Tragic 22.3% |
| Liberians | 1.4 /100 | #246 | Tragic 22.4% |
| Immigrants | El Salvador | 1.4 /100 | #247 | Tragic 22.4% |
| Belizeans | 1.4 /100 | #248 | Tragic 22.4% |
| Immigrants | Caribbean | 1.3 /100 | #249 | Tragic 22.4% |
| Immigrants | Bahamas | 1.2 /100 | #250 | Tragic 22.5% |
| Immigrants | West Indies | 1.0 /100 | #251 | Tragic 22.5% |
| Delaware | 1.0 /100 | #252 | Tragic 22.5% |
| Immigrants | Liberia | 0.9 /100 | #253 | Tragic 22.5% |
| Immigrants | Burma/Myanmar | 0.8 /100 | #254 | Tragic 22.6% |
| Immigrants | Sudan | 0.8 /100 | #255 | Tragic 22.6% |