Menominee vs African Single Female Poverty
COMPARE
Menominee
African
Single Female Poverty
Single Female Poverty Comparison
Menominee
Africans
27.8%
SINGLE FEMALE POVERTY
0.0/ 100
METRIC RATING
329th/ 347
METRIC RANK
24.8%
SINGLE FEMALE POVERTY
0.0/ 100
METRIC RATING
296th/ 347
METRIC RANK
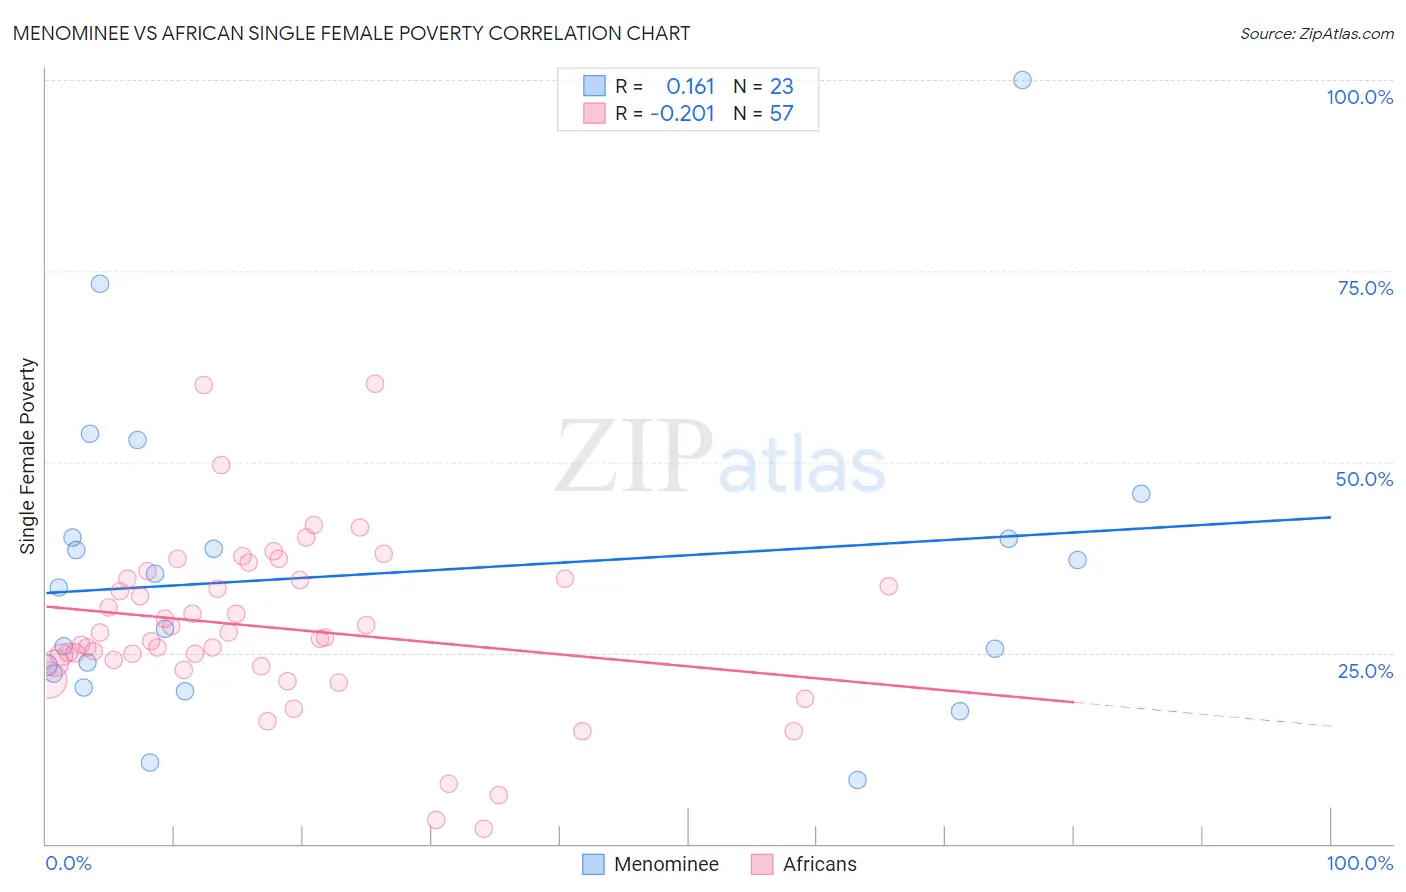
Menominee vs African Single Female Poverty Correlation Chart
The statistical analysis conducted on geographies consisting of 45,620,212 people shows a poor positive correlation between the proportion of Menominee and poverty level among single females in the United States with a correlation coefficient (R) of 0.161 and weighted average of 27.8%. Similarly, the statistical analysis conducted on geographies consisting of 463,525,497 people shows a weak negative correlation between the proportion of Africans and poverty level among single females in the United States with a correlation coefficient (R) of -0.201 and weighted average of 24.8%, a difference of 12.5%.
Single Female Poverty Correlation Summary
| Measurement | Menominee | African |
| Minimum | 8.3% | 1.9% |
| Maximum | 100.0% | 60.3% |
| Range | 91.7% | 58.4% |
| Mean | 35.4% | 28.3% |
| Median | 33.5% | 27.0% |
| Interquartile 25% (IQ1) | 22.3% | 23.4% |
| Interquartile 75% (IQ3) | 40.1% | 34.6% |
| Interquartile Range (IQR) | 17.8% | 11.2% |
| Standard Deviation (Sample) | 20.5% | 11.2% |
| Standard Deviation (Population) | 20.1% | 11.1% |
Similar Demographics by Single Female Poverty
Demographics Similar to Menominee by Single Female Poverty
In terms of single female poverty, the demographic groups most similar to Menominee are Apache (27.7%, a difference of 0.46%), Hopi (28.0%, a difference of 0.71%), Native/Alaskan (28.2%, a difference of 1.3%), Dutch West Indian (27.5%, a difference of 1.4%), and Creek (27.4%, a difference of 1.5%).
| Demographics | Rating | Rank | Single Female Poverty |
| Seminole | 0.0 /100 | #322 | Tragic 26.8% |
| Chippewa | 0.0 /100 | #323 | Tragic 26.8% |
| Kiowa | 0.0 /100 | #324 | Tragic 26.9% |
| Choctaw | 0.0 /100 | #325 | Tragic 27.2% |
| Creek | 0.0 /100 | #326 | Tragic 27.4% |
| Dutch West Indians | 0.0 /100 | #327 | Tragic 27.5% |
| Apache | 0.0 /100 | #328 | Tragic 27.7% |
| Menominee | 0.0 /100 | #329 | Tragic 27.8% |
| Hopi | 0.0 /100 | #330 | Tragic 28.0% |
| Natives/Alaskans | 0.0 /100 | #331 | Tragic 28.2% |
| Yakama | 0.0 /100 | #332 | Tragic 28.3% |
| Ute | 0.0 /100 | #333 | Tragic 28.4% |
| Pueblo | 0.0 /100 | #334 | Tragic 28.6% |
| Immigrants | Yemen | 0.0 /100 | #335 | Tragic 28.9% |
| Colville | 0.0 /100 | #336 | Tragic 29.1% |
Demographics Similar to Africans by Single Female Poverty
In terms of single female poverty, the demographic groups most similar to Africans are Immigrants from Central America (24.8%, a difference of 0.28%), Hispanic or Latino (24.6%, a difference of 0.48%), Yaqui (24.9%, a difference of 0.48%), French American Indian (24.6%, a difference of 0.83%), and American (24.5%, a difference of 0.98%).
| Demographics | Rating | Rank | Single Female Poverty |
| U.S. Virgin Islanders | 0.0 /100 | #289 | Tragic 24.2% |
| Indonesians | 0.0 /100 | #290 | Tragic 24.3% |
| Osage | 0.0 /100 | #291 | Tragic 24.4% |
| Alsatians | 0.0 /100 | #292 | Tragic 24.5% |
| Americans | 0.0 /100 | #293 | Tragic 24.5% |
| French American Indians | 0.0 /100 | #294 | Tragic 24.6% |
| Hispanics or Latinos | 0.0 /100 | #295 | Tragic 24.6% |
| Africans | 0.0 /100 | #296 | Tragic 24.8% |
| Immigrants | Central America | 0.0 /100 | #297 | Tragic 24.8% |
| Yaqui | 0.0 /100 | #298 | Tragic 24.9% |
| Mexicans | 0.0 /100 | #299 | Tragic 25.0% |
| Blackfeet | 0.0 /100 | #300 | Tragic 25.1% |
| Hondurans | 0.0 /100 | #301 | Tragic 25.1% |
| Shoshone | 0.0 /100 | #302 | Tragic 25.1% |
| Somalis | 0.0 /100 | #303 | Tragic 25.2% |