Immigrants from Southern Europe vs Native Hawaiian Single Father Poverty

COMPARE

Immigrants from Southern Europe
Race
Ancestry
AfghanAfricanAlaska NativeAlaskan AthabascanAlbanianAleutAlsatianAmericanApacheArabArapahoArgentineanArmenianAssyrian/Chaldean/SyriacAustralianAustrianBahamianBangladeshiBarbadianBasqueBelgianBelizeanBermudanBhutaneseBlackfeetBolivianBrazilianBritishBritish West IndianBulgarianBurmeseCajunCambodianCanadianCape VerdeanCarpatho RusynCelticCentral AmericanCentral American IndianCherokeeCheyenneChickasawChileanChineseChippewaChoctawColombianColvilleComancheCosta RicanCreeCreekCroatianCrowCubanCypriotCzechCzechoslovakianDanishDelawareDominicanDutchDutch West IndianEastern EuropeanEcuadorianEgyptianEnglishEstonianEthiopianEuropeanFijianFilipinoFinnishFrenchFrench American IndianFrench CanadianGermanGerman RussianGhanaianGreekGuamanian/ChamorroGuatemalanGuyaneseHaitianHmongHonduranHopiHoumaHungarianIcelanderIndian (Asian)IndonesianInupiatIranianIraqiIrishIroquoisIsraeliItalianJamaicanJapaneseJordanianKenyanKiowaKoreanLaotianLatvianLebaneseLiberianLithuanianLumbeeLuxembourgerMacedonianMalaysianMalteseMarshalleseMenomineeMexicanMexican American IndianMongolianMoroccanNavajoNepaleseNew ZealanderNicaraguanNigerianNorthern EuropeanNorwegianOkinawanOsageOttawaPaiutePakistaniPalestinianPanamanianParaguayanPennsylvania GermanPeruvianPimaPolishPortuguesePotawatomiPuebloPuerto RicanPuget Sound SalishRomanianRussianSalvadoranSamoanScandinavianScotch-IrishScottishSeminoleSenegaleseSerbianShoshoneSierra LeoneanSiouxSlavicSlovakSloveneSomaliSouth AfricanSouth AmericanSouth American IndianSoviet UnionSpaniardSpanishSpanish AmericanSpanish American IndianSri LankanSubsaharan AfricanSudaneseSwedishSwissSyrianTaiwaneseThaiTlingit-HaidaTohono O'OdhamTonganTrinidadian and TobagonianTsimshianTurkishU.S. Virgin IslanderUgandanUkrainianUruguayanUteVenezuelanVietnameseWelshWest IndianYakamaYaquiYugoslavianYumanYup'ikZimbabwean
Immigration
NonimmigrantsImmigrantsAfghanistanAfricaAlbaniaArgentinaArmeniaAsiaAustraliaAustriaBahamasBangladeshBarbadosBelarusBelgiumBelizeBoliviaBosnia and HerzegovinaBrazilBulgariaBurma/MyanmarCabo VerdeCambodiaCameroonCanadaCaribbeanCentral AmericaChileChinaColombiaCongoCosta RicaCroatiaCubaCzechoslovakiaDenmarkDominicaDominican RepublicEastern AfricaEastern AsiaEastern EuropeEcuadorEgyptEl SalvadorEnglandEritreaEthiopiaEuropeFijiFranceGermanyGhanaGreeceGrenadaGuatemalaGuyanaHaitiHondurasHong KongHungaryIndiaIndonesiaIranIraqIrelandIsraelItalyJamaicaJapanJordanKazakhstanKenyaKoreaKuwaitLaosLatin AmericaLatviaLebanonLiberiaLithuaniaMalaysiaMexicoMicronesiaMiddle AfricaMoldovaMoroccoNepalNetherlandsNicaraguaNigeriaNorth AmericaNorth MacedoniaNorthern AfricaNorthern EuropeNorwayOceaniaPakistanPanamaPeruPhilippinesPolandPortugalRomaniaRussiaSaudi ArabiaScotlandSenegalSerbiaSierra LeoneSingaporeSomaliaSouth AfricaSouth AmericaSouth Central AsiaSouth Eastern AsiaSouthern EuropeSpainSri LankaSt. Vincent and the GrenadinesSudanSwedenSwitzerlandSyriaTaiwanThailandTrinidad and TobagoTurkeyUgandaUkraineUruguayUzbekistanVenezuelaVietnamWest IndiesWestern AfricaWestern AsiaWestern EuropeYemenZaireZimbabweAzores
Native Hawaiian
Race
Ancestry
AfghanAfricanAlaska NativeAlaskan AthabascanAlbanianAleutAlsatianAmericanApacheArabArapahoArgentineanArmenianAssyrian/Chaldean/SyriacAustralianAustrianBahamianBangladeshiBarbadianBasqueBelgianBelizeanBermudanBhutaneseBlackfeetBolivianBrazilianBritishBritish West IndianBulgarianBurmeseCajunCambodianCanadianCape VerdeanCarpatho RusynCelticCentral AmericanCentral American IndianCherokeeCheyenneChickasawChileanChineseChippewaChoctawColombianColvilleComancheCosta RicanCreeCreekCroatianCrowCubanCypriotCzechCzechoslovakianDanishDelawareDominicanDutchDutch West IndianEastern EuropeanEcuadorianEgyptianEnglishEstonianEthiopianEuropeanFijianFilipinoFinnishFrenchFrench American IndianFrench CanadianGermanGerman RussianGhanaianGreekGuamanian/ChamorroGuatemalanGuyaneseHaitianHmongHonduranHopiHoumaHungarianIcelanderIndian (Asian)IndonesianInupiatIranianIraqiIrishIroquoisIsraeliItalianJamaicanJapaneseJordanianKenyanKiowaKoreanLaotianLatvianLebaneseLiberianLithuanianLumbeeLuxembourgerMacedonianMalaysianMalteseMarshalleseMenomineeMexicanMexican American IndianMongolianMoroccanNative HawaiianNavajoNepaleseNew ZealanderNicaraguanNigerianNorthern EuropeanNorwegianOkinawanOsageOttawaPaiutePakistaniPalestinianPanamanianParaguayanPennsylvania GermanPeruvianPimaPolishPortuguesePotawatomiPuebloPuerto RicanPuget Sound SalishRomanianRussianSalvadoranSamoanScandinavianScotch-IrishScottishSeminoleSenegaleseSerbianShoshoneSierra LeoneanSiouxSlavicSlovakSloveneSomaliSouth AfricanSouth AmericanSouth American IndianSoviet UnionSpaniardSpanishSpanish AmericanSpanish American IndianSri LankanSubsaharan AfricanSudaneseSwedishSwissSyrianTaiwaneseThaiTlingit-HaidaTohono O'OdhamTonganTrinidadian and TobagonianTsimshianTurkishU.S. Virgin IslanderUgandanUkrainianUruguayanUteVenezuelanVietnameseWelshWest IndianYakamaYaquiYugoslavianYumanYup'ikZimbabwean
Immigration
NonimmigrantsImmigrantsAfghanistanAfricaAlbaniaArgentinaArmeniaAsiaAustraliaAustriaBahamasBangladeshBarbadosBelarusBelgiumBelizeBoliviaBosnia and HerzegovinaBrazilBulgariaBurma/MyanmarCabo VerdeCambodiaCameroonCanadaCaribbeanCentral AmericaChileChinaColombiaCongoCosta RicaCroatiaCubaCzechoslovakiaDenmarkDominicaDominican RepublicEastern AfricaEastern AsiaEastern EuropeEcuadorEgyptEl SalvadorEnglandEritreaEthiopiaEuropeFijiFranceGermanyGhanaGreeceGrenadaGuatemalaGuyanaHaitiHondurasHong KongHungaryIndiaIndonesiaIranIraqIrelandIsraelItalyJamaicaJapanJordanKazakhstanKenyaKoreaKuwaitLaosLatin AmericaLatviaLebanonLiberiaLithuaniaMalaysiaMexicoMicronesiaMiddle AfricaMoldovaMoroccoNepalNetherlandsNicaraguaNigeriaNorth AmericaNorth MacedoniaNorthern AfricaNorthern EuropeNorwayOceaniaPakistanPanamaPeruPhilippinesPolandPortugalRomaniaRussiaSaudi ArabiaScotlandSenegalSerbiaSierra LeoneSingaporeSomaliaSouth AfricaSouth AmericaSouth Central AsiaSouth Eastern AsiaSpainSri LankaSt. Vincent and the GrenadinesSudanSwedenSwitzerlandSyriaTaiwanThailandTrinidad and TobagoTurkeyUgandaUkraineUruguayUzbekistanVenezuelaVietnamWest IndiesWestern AfricaWestern AsiaWestern EuropeYemenZaireZimbabweAzores
Single Father Poverty
Income
Poverty
Unemployment
Labor Participation
Family Structure
Vehicle Availability
Education Level
Disability

Single Father Poverty Comparison

Immigrants from Southern Europe

Native Hawaiians

Poor
Exceptional
16.7%
SINGLE FATHER POVERTY
11.2/ 100
METRIC RATING
212th/ 347
METRIC RANK
15.7%
SINGLE FATHER POVERTY
95.8/ 100
METRIC RATING
107th/ 347
METRIC RANK

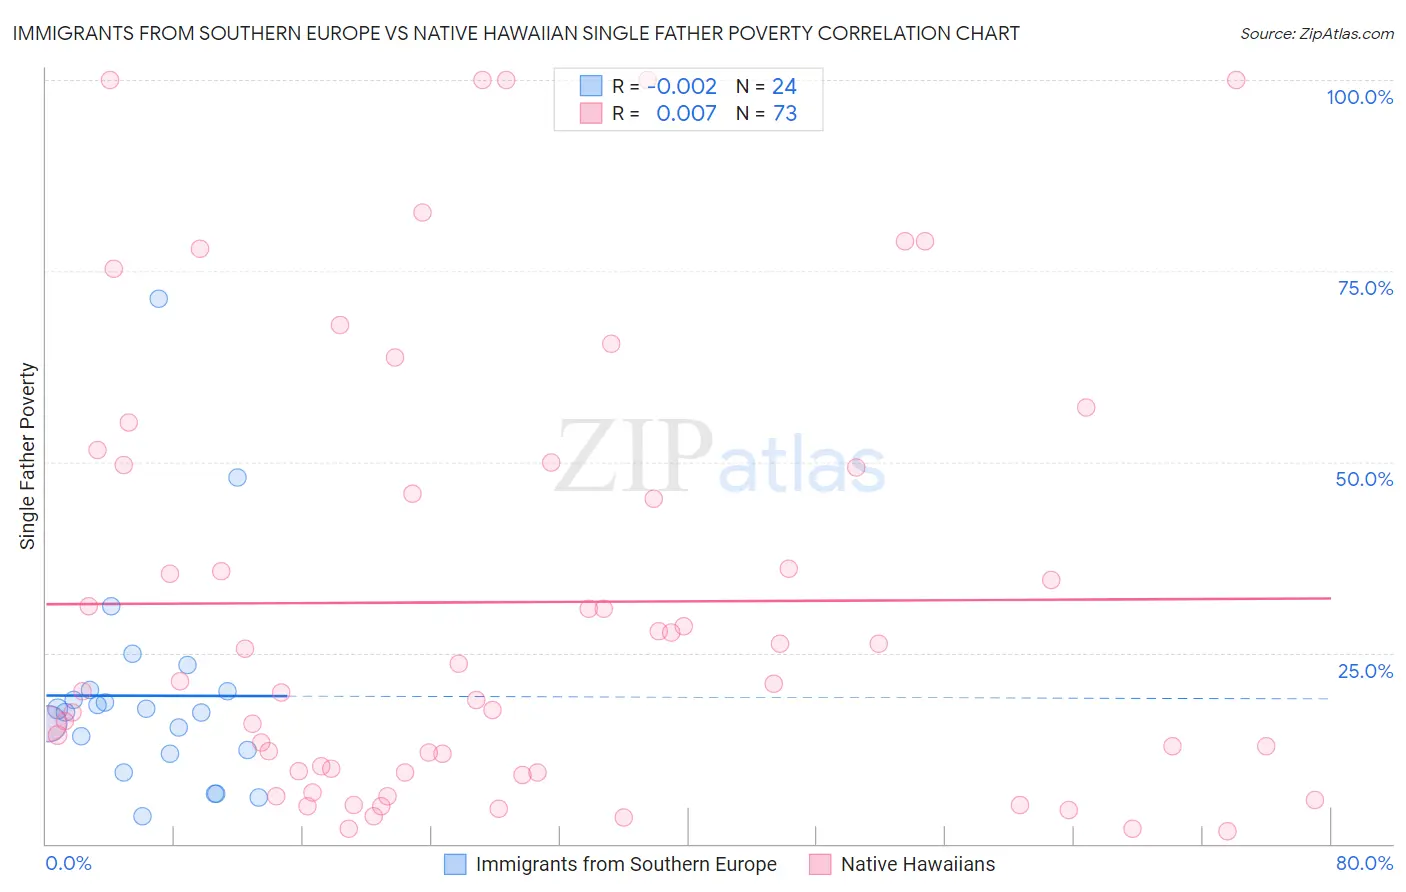
Immigrants from Southern Europe vs Native Hawaiian Single Father Poverty Correlation Chart

The statistical analysis conducted on geographies consisting of 311,843,806 people shows no correlation between the proportion of Immigrants from Southern Europe and poverty level among single fathers in the United States with a correlation coefficient (R) of -0.002 and weighted average of 16.7%. Similarly, the statistical analysis conducted on geographies consisting of 273,491,221 people shows no correlation between the proportion of Native Hawaiians and poverty level among single fathers in the United States with a correlation coefficient (R) of 0.007 and weighted average of 15.7%, a difference of 5.9%.
Immigrants from Southern Europe vs Native Hawaiian Single Father Poverty

Single Father Poverty Correlation Summary

MeasurementImmigrants from Southern EuropeNative Hawaiian
Minimum3.6%1.7%
Maximum71.4%100.0%
Range67.9%98.3%
Mean19.4%31.6%
Median17.4%20.9%
Interquartile 25% (IQ1)12.0%9.4%
Interquartile 75% (IQ3)20.1%49.4%
Interquartile Range (IQR)8.1%40.0%
Standard Deviation (Sample)14.4%28.8%
Standard Deviation (Population)14.1%28.6%

Similar Demographics by Single Father Poverty

Demographics Similar to Immigrants from Southern Europe by Single Father Poverty

In terms of single father poverty, the demographic groups most similar to Immigrants from Southern Europe are Ghanaian (16.7%, a difference of 0.020%), Spanish (16.7%, a difference of 0.050%), Arab (16.6%, a difference of 0.17%), Guatemalan (16.6%, a difference of 0.18%), and Immigrants from Scotland (16.7%, a difference of 0.19%).
DemographicsRating | RankSingle Father Poverty
Venezuelans
14.3
/100
|
#205
Poor
16.6%
Immigrants | Senegal
13.7
/100
|
#206
Poor
16.6%
New Zealanders
13.7
/100
|
#207
Poor
16.6%
Eastern Europeans
13.7
/100
|
#208
Poor
16.6%
Europeans
13.2
/100
|
#209
Poor
16.6%
Guatemalans
12.9
/100
|
#210
Poor
16.6%
Arabs
12.8
/100
|
#211
Poor
16.6%
Immigrants | Southern Europe
11.2
/100
|
#212
Poor
16.7%
Ghanaians
11.0
/100
|
#213
Poor
16.7%
Spanish
10.7
/100
|
#214
Poor
16.7%
Immigrants | Scotland
9.6
/100
|
#215
Tragic
16.7%
Immigrants | England
9.5
/100
|
#216
Tragic
16.7%
Cheyenne
9.3
/100
|
#217
Tragic
16.7%
Immigrants | Uganda
8.6
/100
|
#218
Tragic
16.7%
Immigrants | Ghana
8.1
/100
|
#219
Tragic
16.7%

Demographics Similar to Native Hawaiians by Single Father Poverty

In terms of single father poverty, the demographic groups most similar to Native Hawaiians are Pakistani (15.7%, a difference of 0.010%), Immigrants from Poland (15.7%, a difference of 0.020%), Immigrants from Australia (15.7%, a difference of 0.090%), Australian (15.7%, a difference of 0.10%), and South American Indian (15.7%, a difference of 0.12%).
DemographicsRating | RankSingle Father Poverty
Immigrants | Chile
96.9
/100
|
#100
Exceptional
15.7%
Fijians
96.8
/100
|
#101
Exceptional
15.7%
Chileans
96.4
/100
|
#102
Exceptional
15.7%
South American Indians
96.2
/100
|
#103
Exceptional
15.7%
Australians
96.1
/100
|
#104
Exceptional
15.7%
Immigrants | Australia
96.1
/100
|
#105
Exceptional
15.7%
Immigrants | Poland
95.8
/100
|
#106
Exceptional
15.7%
Native Hawaiians
95.8
/100
|
#107
Exceptional
15.7%
Pakistanis
95.7
/100
|
#108
Exceptional
15.7%
Turks
95.1
/100
|
#109
Exceptional
15.8%
Immigrants | Africa
95.1
/100
|
#110
Exceptional
15.8%
Bulgarians
94.8
/100
|
#111
Exceptional
15.8%
Immigrants | Latvia
94.7
/100
|
#112
Exceptional
15.8%
Danes
94.5
/100
|
#113
Exceptional
15.8%
Argentineans
94.4
/100
|
#114
Exceptional
15.8%