Osage vs Native Hawaiian Single Father Poverty
COMPARE
Osage
Native Hawaiian
Single Father Poverty
Single Father Poverty Comparison
Osage
Native Hawaiians
19.0%
SINGLE FATHER POVERTY
0.0/ 100
METRIC RATING
316th/ 347
METRIC RANK
15.7%
SINGLE FATHER POVERTY
95.8/ 100
METRIC RATING
107th/ 347
METRIC RANK
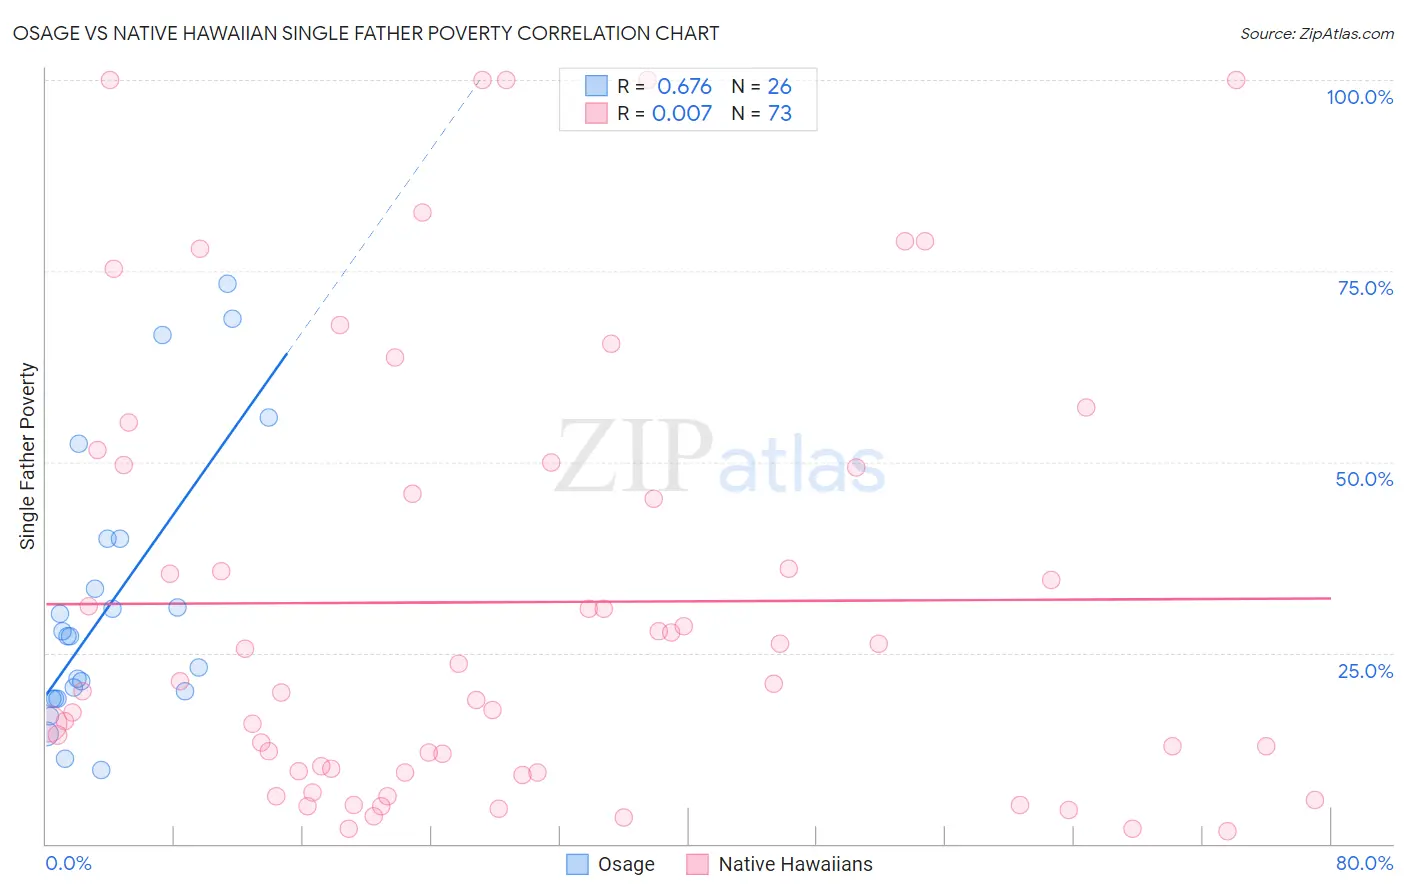
Osage vs Native Hawaiian Single Father Poverty Correlation Chart
The statistical analysis conducted on geographies consisting of 82,975,637 people shows a significant positive correlation between the proportion of Osage and poverty level among single fathers in the United States with a correlation coefficient (R) of 0.676 and weighted average of 19.0%. Similarly, the statistical analysis conducted on geographies consisting of 273,491,221 people shows no correlation between the proportion of Native Hawaiians and poverty level among single fathers in the United States with a correlation coefficient (R) of 0.007 and weighted average of 15.7%, a difference of 20.9%.
Single Father Poverty Correlation Summary
| Measurement | Osage | Native Hawaiian |
| Minimum | 9.7% | 1.7% |
| Maximum | 73.3% | 100.0% |
| Range | 63.7% | 98.3% |
| Mean | 31.5% | 31.6% |
| Median | 27.1% | 20.9% |
| Interquartile 25% (IQ1) | 19.0% | 9.4% |
| Interquartile 75% (IQ3) | 40.0% | 49.4% |
| Interquartile Range (IQR) | 21.0% | 40.0% |
| Standard Deviation (Sample) | 17.9% | 28.8% |
| Standard Deviation (Population) | 17.5% | 28.6% |
Similar Demographics by Single Father Poverty
Demographics Similar to Osage by Single Father Poverty
In terms of single father poverty, the demographic groups most similar to Osage are Dominican (19.1%, a difference of 0.31%), Chickasaw (19.0%, a difference of 0.40%), Delaware (18.9%, a difference of 0.56%), Potawatomi (18.9%, a difference of 0.72%), and Dutch West Indian (19.2%, a difference of 0.89%).
| Demographics | Rating | Rank | Single Father Poverty |
| Immigrants | Micronesia | 0.0 /100 | #309 | Tragic 18.6% |
| Chippewa | 0.0 /100 | #310 | Tragic 18.8% |
| Immigrants | Nonimmigrants | 0.0 /100 | #311 | Tragic 18.8% |
| Immigrants | Dominica | 0.0 /100 | #312 | Tragic 18.9% |
| Potawatomi | 0.0 /100 | #313 | Tragic 18.9% |
| Delaware | 0.0 /100 | #314 | Tragic 18.9% |
| Chickasaw | 0.0 /100 | #315 | Tragic 19.0% |
| Osage | 0.0 /100 | #316 | Tragic 19.0% |
| Dominicans | 0.0 /100 | #317 | Tragic 19.1% |
| Dutch West Indians | 0.0 /100 | #318 | Tragic 19.2% |
| Slovaks | 0.0 /100 | #319 | Tragic 19.3% |
| Inupiat | 0.0 /100 | #320 | Tragic 19.5% |
| Cherokee | 0.0 /100 | #321 | Tragic 19.6% |
| Creek | 0.0 /100 | #322 | Tragic 19.8% |
| Pennsylvania Germans | 0.0 /100 | #323 | Tragic 20.0% |
Demographics Similar to Native Hawaiians by Single Father Poverty
In terms of single father poverty, the demographic groups most similar to Native Hawaiians are Pakistani (15.7%, a difference of 0.010%), Immigrants from Poland (15.7%, a difference of 0.020%), Immigrants from Australia (15.7%, a difference of 0.090%), Australian (15.7%, a difference of 0.10%), and South American Indian (15.7%, a difference of 0.12%).
| Demographics | Rating | Rank | Single Father Poverty |
| Immigrants | Chile | 96.9 /100 | #100 | Exceptional 15.7% |
| Fijians | 96.8 /100 | #101 | Exceptional 15.7% |
| Chileans | 96.4 /100 | #102 | Exceptional 15.7% |
| South American Indians | 96.2 /100 | #103 | Exceptional 15.7% |
| Australians | 96.1 /100 | #104 | Exceptional 15.7% |
| Immigrants | Australia | 96.1 /100 | #105 | Exceptional 15.7% |
| Immigrants | Poland | 95.8 /100 | #106 | Exceptional 15.7% |
| Native Hawaiians | 95.8 /100 | #107 | Exceptional 15.7% |
| Pakistanis | 95.7 /100 | #108 | Exceptional 15.7% |
| Turks | 95.1 /100 | #109 | Exceptional 15.8% |
| Immigrants | Africa | 95.1 /100 | #110 | Exceptional 15.8% |
| Bulgarians | 94.8 /100 | #111 | Exceptional 15.8% |
| Immigrants | Latvia | 94.7 /100 | #112 | Exceptional 15.8% |
| Danes | 94.5 /100 | #113 | Exceptional 15.8% |
| Argentineans | 94.4 /100 | #114 | Exceptional 15.8% |