Marshallese vs Immigrants from Europe In Labor Force | Age 45-54
COMPARE
Marshallese
Immigrants from Europe
In Labor Force | Age 45-54
In Labor Force | Age 45-54 Comparison
Marshallese
Immigrants from Europe
80.3%
IN LABOR FORCE | AGE 45-54
0.0/ 100
METRIC RATING
298th/ 347
METRIC RANK
83.2%
IN LABOR FORCE | AGE 45-54
90.7/ 100
METRIC RATING
118th/ 347
METRIC RANK
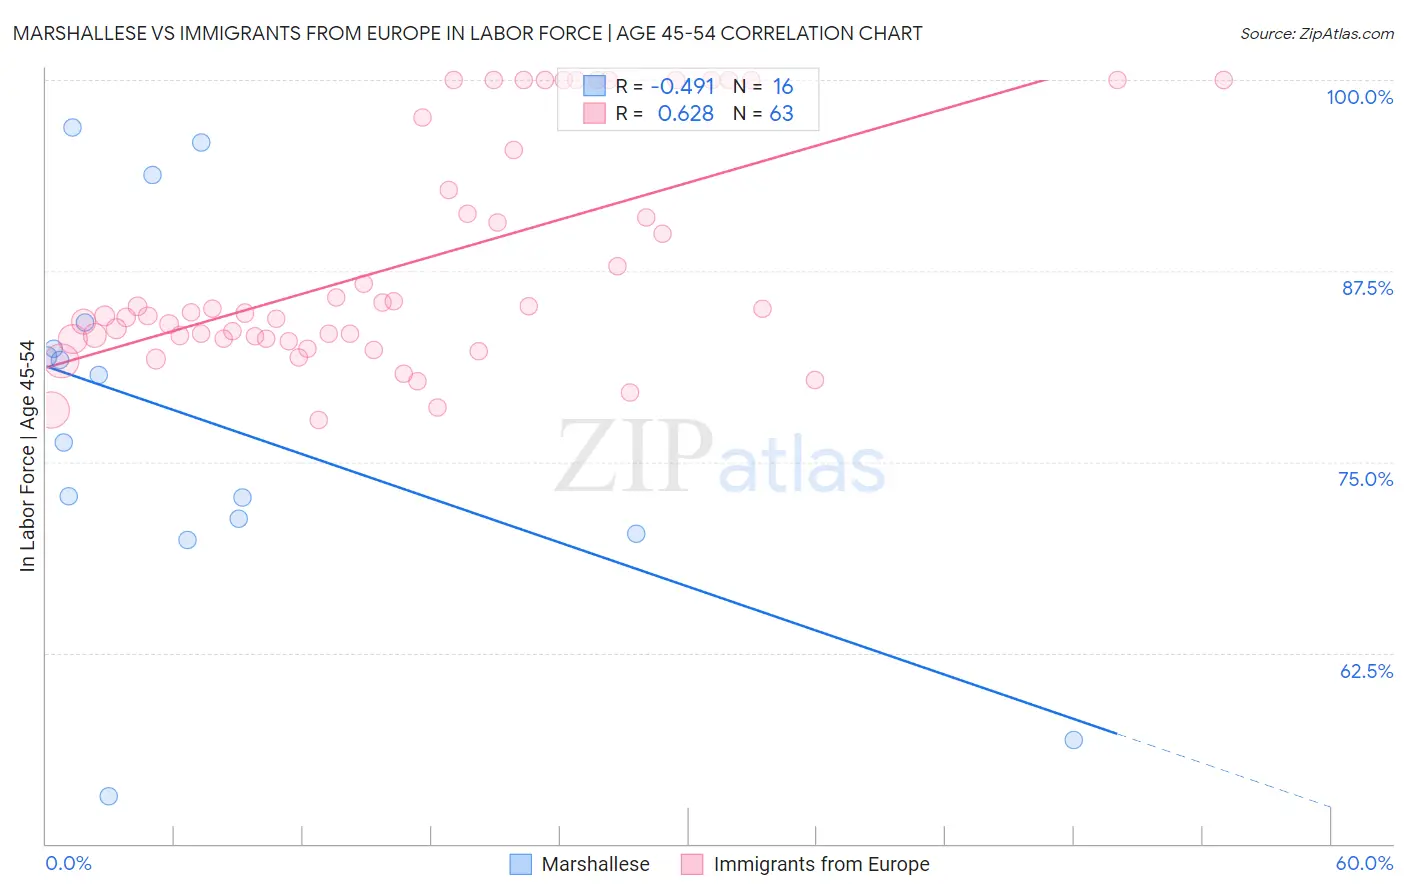
Marshallese vs Immigrants from Europe In Labor Force | Age 45-54 Correlation Chart
The statistical analysis conducted on geographies consisting of 14,761,315 people shows a moderate negative correlation between the proportion of Marshallese and labor force participation rate among population between the ages 45 and 54 in the United States with a correlation coefficient (R) of -0.491 and weighted average of 80.3%. Similarly, the statistical analysis conducted on geographies consisting of 546,802,439 people shows a significant positive correlation between the proportion of Immigrants from Europe and labor force participation rate among population between the ages 45 and 54 in the United States with a correlation coefficient (R) of 0.628 and weighted average of 83.2%, a difference of 3.5%.
In Labor Force | Age 45-54 Correlation Summary
| Measurement | Marshallese | Immigrants from Europe |
| Minimum | 53.1% | 77.7% |
| Maximum | 96.9% | 100.0% |
| Range | 43.8% | 22.3% |
| Mean | 77.5% | 88.0% |
| Median | 78.5% | 84.7% |
| Interquartile 25% (IQ1) | 70.8% | 83.1% |
| Interquartile 75% (IQ3) | 83.3% | 95.5% |
| Interquartile Range (IQR) | 12.5% | 12.4% |
| Standard Deviation (Sample) | 12.4% | 7.4% |
| Standard Deviation (Population) | 12.0% | 7.3% |
Similar Demographics by In Labor Force | Age 45-54
Demographics Similar to Marshallese by In Labor Force | Age 45-54
In terms of in labor force | age 45-54, the demographic groups most similar to Marshallese are American (80.4%, a difference of 0.040%), Dominican (80.3%, a difference of 0.11%), Fijian (80.2%, a difference of 0.11%), Spanish American Indian (80.2%, a difference of 0.13%), and Immigrants from Central America (80.2%, a difference of 0.20%).
| Demographics | Rating | Rank | In Labor Force | Age 45-54 |
| Immigrants | Belize | 0.0 /100 | #291 | Tragic 80.6% |
| Iroquois | 0.0 /100 | #292 | Tragic 80.6% |
| Osage | 0.0 /100 | #293 | Tragic 80.6% |
| Yakama | 0.0 /100 | #294 | Tragic 80.6% |
| Nepalese | 0.0 /100 | #295 | Tragic 80.5% |
| Africans | 0.0 /100 | #296 | Tragic 80.5% |
| Americans | 0.0 /100 | #297 | Tragic 80.4% |
| Marshallese | 0.0 /100 | #298 | Tragic 80.3% |
| Dominicans | 0.0 /100 | #299 | Tragic 80.3% |
| Fijians | 0.0 /100 | #300 | Tragic 80.2% |
| Spanish American Indians | 0.0 /100 | #301 | Tragic 80.2% |
| Immigrants | Central America | 0.0 /100 | #302 | Tragic 80.2% |
| Immigrants | Azores | 0.0 /100 | #303 | Tragic 80.1% |
| Hispanics or Latinos | 0.0 /100 | #304 | Tragic 80.1% |
| Immigrants | Dominican Republic | 0.0 /100 | #305 | Tragic 80.1% |
Demographics Similar to Immigrants from Europe by In Labor Force | Age 45-54
In terms of in labor force | age 45-54, the demographic groups most similar to Immigrants from Europe are Immigrants from China (83.2%, a difference of 0.010%), Immigrants from Uruguay (83.2%, a difference of 0.010%), Immigrants from Russia (83.2%, a difference of 0.010%), Immigrants from Chile (83.2%, a difference of 0.020%), and Immigrants from Malaysia (83.2%, a difference of 0.020%).
| Demographics | Rating | Rank | In Labor Force | Age 45-54 |
| Immigrants | Italy | 92.5 /100 | #111 | Exceptional 83.2% |
| Immigrants | Afghanistan | 92.4 /100 | #112 | Exceptional 83.2% |
| Immigrants | Albania | 91.8 /100 | #113 | Exceptional 83.2% |
| Assyrians/Chaldeans/Syriacs | 91.7 /100 | #114 | Exceptional 83.2% |
| Immigrants | Chile | 91.6 /100 | #115 | Exceptional 83.2% |
| Immigrants | Malaysia | 91.4 /100 | #116 | Exceptional 83.2% |
| Immigrants | China | 90.9 /100 | #117 | Exceptional 83.2% |
| Immigrants | Europe | 90.7 /100 | #118 | Exceptional 83.2% |
| Immigrants | Uruguay | 90.2 /100 | #119 | Exceptional 83.2% |
| Immigrants | Russia | 90.1 /100 | #120 | Exceptional 83.2% |
| Uruguayans | 89.4 /100 | #121 | Excellent 83.1% |
| Immigrants | Vietnam | 88.9 /100 | #122 | Excellent 83.1% |
| Tongans | 88.2 /100 | #123 | Excellent 83.1% |
| Bermudans | 88.0 /100 | #124 | Excellent 83.1% |
| Immigrants | Iran | 87.2 /100 | #125 | Excellent 83.1% |