Thai vs Immigrants from Europe Single Father Poverty
COMPARE
Thai
Immigrants from Europe
Single Father Poverty
Single Father Poverty Comparison
Thais
Immigrants from Europe
14.5%
SINGLE FATHER POVERTY
100.0/ 100
METRIC RATING
30th/ 347
METRIC RANK
16.3%
SINGLE FATHER POVERTY
54.8/ 100
METRIC RATING
166th/ 347
METRIC RANK
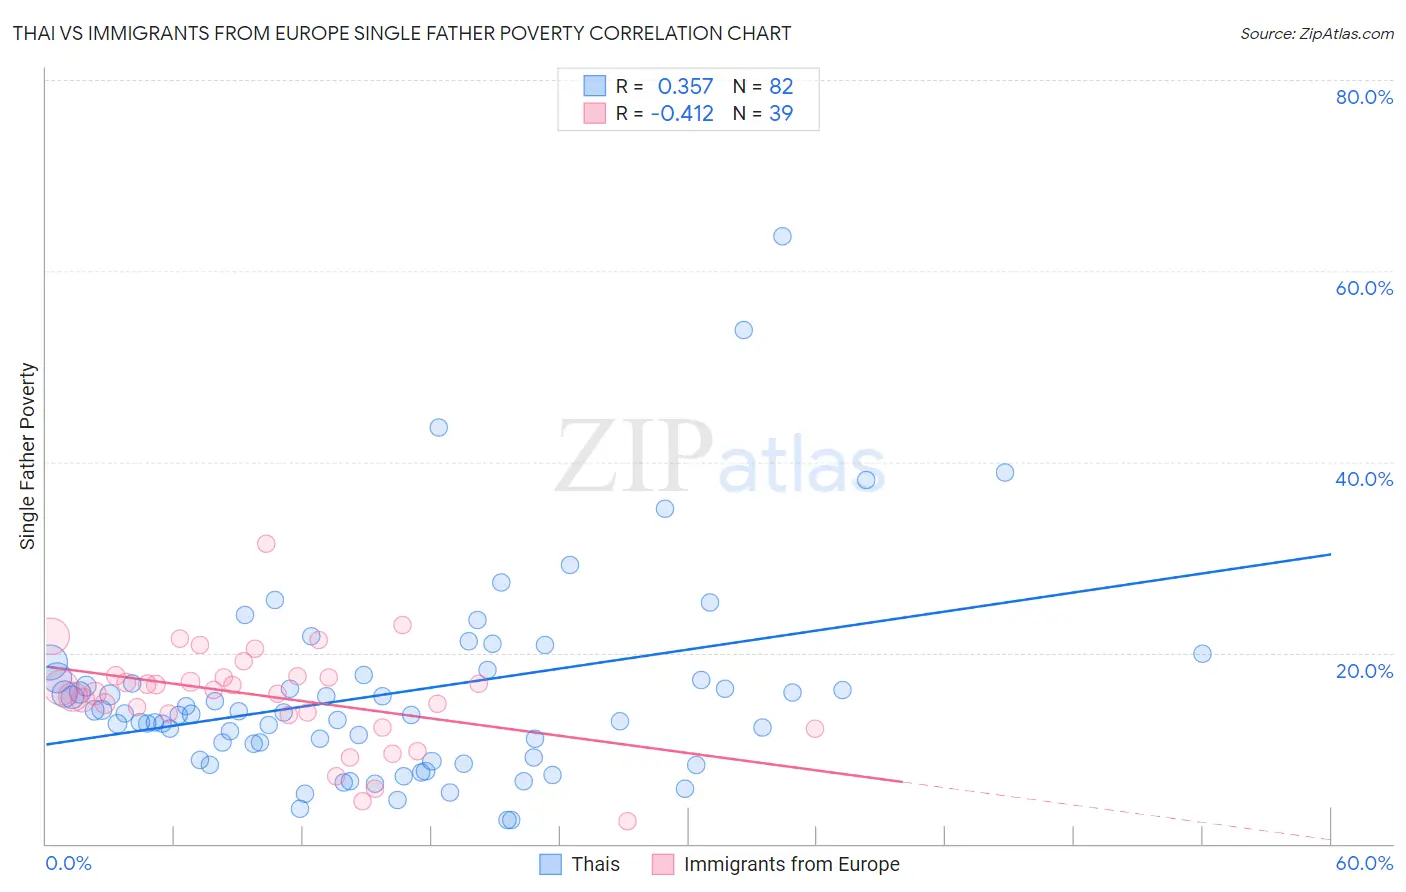
Thai vs Immigrants from Europe Single Father Poverty Correlation Chart
The statistical analysis conducted on geographies consisting of 363,511,447 people shows a mild positive correlation between the proportion of Thais and poverty level among single fathers in the United States with a correlation coefficient (R) of 0.357 and weighted average of 14.5%. Similarly, the statistical analysis conducted on geographies consisting of 399,898,147 people shows a moderate negative correlation between the proportion of Immigrants from Europe and poverty level among single fathers in the United States with a correlation coefficient (R) of -0.412 and weighted average of 16.3%, a difference of 11.9%.
Single Father Poverty Correlation Summary
| Measurement | Thai | Immigrants from Europe |
| Minimum | 2.5% | 2.4% |
| Maximum | 63.6% | 31.4% |
| Range | 61.2% | 29.0% |
| Mean | 15.7% | 15.4% |
| Median | 13.6% | 16.1% |
| Interquartile 25% (IQ1) | 9.0% | 13.5% |
| Interquartile 75% (IQ3) | 17.4% | 17.5% |
| Interquartile Range (IQR) | 8.4% | 4.0% |
| Standard Deviation (Sample) | 10.5% | 5.4% |
| Standard Deviation (Population) | 10.4% | 5.4% |
Similar Demographics by Single Father Poverty
Demographics Similar to Thais by Single Father Poverty
In terms of single father poverty, the demographic groups most similar to Thais are Somali (14.5%, a difference of 0.040%), Icelander (14.5%, a difference of 0.080%), Immigrants from South Central Asia (14.5%, a difference of 0.15%), Asian (14.6%, a difference of 0.24%), and Nepalese (14.4%, a difference of 0.68%).
| Demographics | Rating | Rank | Single Father Poverty |
| Immigrants | Egypt | 100.0 /100 | #23 | Exceptional 14.4% |
| Immigrants | South Eastern Asia | 100.0 /100 | #24 | Exceptional 14.4% |
| Iranians | 100.0 /100 | #25 | Exceptional 14.4% |
| Spanish American Indians | 100.0 /100 | #26 | Exceptional 14.4% |
| Nepalese | 100.0 /100 | #27 | Exceptional 14.4% |
| Immigrants | South Central Asia | 100.0 /100 | #28 | Exceptional 14.5% |
| Somalis | 100.0 /100 | #29 | Exceptional 14.5% |
| Thais | 100.0 /100 | #30 | Exceptional 14.5% |
| Icelanders | 100.0 /100 | #31 | Exceptional 14.5% |
| Asians | 100.0 /100 | #32 | Exceptional 14.6% |
| Okinawans | 100.0 /100 | #33 | Exceptional 14.6% |
| Egyptians | 100.0 /100 | #34 | Exceptional 14.7% |
| Immigrants | Bolivia | 100.0 /100 | #35 | Exceptional 14.7% |
| Immigrants | Indonesia | 100.0 /100 | #36 | Exceptional 14.7% |
| Immigrants | Eastern Africa | 100.0 /100 | #37 | Exceptional 14.7% |
Demographics Similar to Immigrants from Europe by Single Father Poverty
In terms of single father poverty, the demographic groups most similar to Immigrants from Europe are Guyanese (16.3%, a difference of 0.010%), Immigrants from Bangladesh (16.3%, a difference of 0.010%), Immigrants from Costa Rica (16.3%, a difference of 0.040%), Yugoslavian (16.3%, a difference of 0.040%), and Ugandan (16.3%, a difference of 0.050%).
| Demographics | Rating | Rank | Single Father Poverty |
| Belizeans | 59.9 /100 | #159 | Average 16.2% |
| Immigrants | Sudan | 59.8 /100 | #160 | Average 16.2% |
| Estonians | 56.7 /100 | #161 | Average 16.2% |
| Ugandans | 55.9 /100 | #162 | Average 16.3% |
| Immigrants | Costa Rica | 55.7 /100 | #163 | Average 16.3% |
| Guyanese | 55.2 /100 | #164 | Average 16.3% |
| Immigrants | Bangladesh | 55.1 /100 | #165 | Average 16.3% |
| Immigrants | Europe | 54.8 /100 | #166 | Average 16.3% |
| Yugoslavians | 53.9 /100 | #167 | Average 16.3% |
| Costa Ricans | 53.6 /100 | #168 | Average 16.3% |
| Northern Europeans | 52.8 /100 | #169 | Average 16.3% |
| Scandinavians | 52.3 /100 | #170 | Average 16.3% |
| Immigrants | Morocco | 50.7 /100 | #171 | Average 16.3% |
| Immigrants | Sierra Leone | 50.1 /100 | #172 | Average 16.3% |
| Immigrants | St. Vincent and the Grenadines | 50.0 /100 | #173 | Average 16.3% |