Immigrants from Western Africa vs Immigrants from Croatia Single Father Poverty

COMPARE

Immigrants from Western Africa
Race
Ancestry
AfghanAfricanAlaska NativeAlaskan AthabascanAlbanianAleutAlsatianAmericanApacheArabArapahoArgentineanArmenianAssyrian/Chaldean/SyriacAustralianAustrianBahamianBangladeshiBarbadianBasqueBelgianBelizeanBermudanBhutaneseBlackfeetBolivianBrazilianBritishBritish West IndianBulgarianBurmeseCajunCambodianCanadianCape VerdeanCarpatho RusynCelticCentral AmericanCentral American IndianCherokeeCheyenneChickasawChileanChineseChippewaChoctawColombianColvilleComancheCosta RicanCreeCreekCroatianCrowCubanCypriotCzechCzechoslovakianDanishDelawareDominicanDutchDutch West IndianEastern EuropeanEcuadorianEgyptianEnglishEstonianEthiopianEuropeanFijianFilipinoFinnishFrenchFrench American IndianFrench CanadianGermanGerman RussianGhanaianGreekGuamanian/ChamorroGuatemalanGuyaneseHaitianHmongHonduranHopiHoumaHungarianIcelanderIndian (Asian)IndonesianInupiatIranianIraqiIrishIroquoisIsraeliItalianJamaicanJapaneseJordanianKenyanKiowaKoreanLaotianLatvianLebaneseLiberianLithuanianLumbeeLuxembourgerMacedonianMalaysianMalteseMarshalleseMenomineeMexicanMexican American IndianMongolianMoroccanNative HawaiianNavajoNepaleseNew ZealanderNicaraguanNigerianNorthern EuropeanNorwegianOkinawanOsageOttawaPaiutePakistaniPalestinianPanamanianParaguayanPennsylvania GermanPeruvianPimaPolishPortuguesePotawatomiPuebloPuerto RicanPuget Sound SalishRomanianRussianSalvadoranSamoanScandinavianScotch-IrishScottishSeminoleSenegaleseSerbianShoshoneSierra LeoneanSiouxSlavicSlovakSloveneSomaliSouth AfricanSouth AmericanSouth American IndianSoviet UnionSpaniardSpanishSpanish AmericanSpanish American IndianSri LankanSubsaharan AfricanSudaneseSwedishSwissSyrianTaiwaneseThaiTlingit-HaidaTohono O'OdhamTonganTrinidadian and TobagonianTsimshianTurkishU.S. Virgin IslanderUgandanUkrainianUruguayanUteVenezuelanVietnameseWelshWest IndianYakamaYaquiYugoslavianYumanYup'ikZimbabwean
Immigration
NonimmigrantsImmigrantsAfghanistanAfricaAlbaniaArgentinaArmeniaAsiaAustraliaAustriaBahamasBangladeshBarbadosBelarusBelgiumBelizeBoliviaBosnia and HerzegovinaBrazilBulgariaBurma/MyanmarCabo VerdeCambodiaCameroonCanadaCaribbeanCentral AmericaChileChinaColombiaCongoCosta RicaCubaCzechoslovakiaDenmarkDominicaDominican RepublicEastern AfricaEastern AsiaEastern EuropeEcuadorEgyptEl SalvadorEnglandEritreaEthiopiaEuropeFijiFranceGermanyGhanaGreeceGrenadaGuatemalaGuyanaHaitiHondurasHong KongHungaryIndiaIndonesiaIranIraqIrelandIsraelItalyJamaicaJapanJordanKazakhstanKenyaKoreaKuwaitLaosLatin AmericaLatviaLebanonLiberiaLithuaniaMalaysiaMexicoMicronesiaMiddle AfricaMoldovaMoroccoNepalNetherlandsNicaraguaNigeriaNorth AmericaNorth MacedoniaNorthern AfricaNorthern EuropeNorwayOceaniaPakistanPanamaPeruPhilippinesPolandPortugalRomaniaRussiaSaudi ArabiaScotlandSenegalSerbiaSierra LeoneSingaporeSomaliaSouth AfricaSouth AmericaSouth Central AsiaSouth Eastern AsiaSouthern EuropeSpainSri LankaSt. Vincent and the GrenadinesSudanSwedenSwitzerlandSyriaTaiwanThailandTrinidad and TobagoTurkeyUgandaUkraineUruguayUzbekistanVenezuelaVietnamWest IndiesWestern AfricaWestern AsiaWestern EuropeYemenZaireZimbabweAzores
Immigrants from Croatia
Race
Ancestry
AfghanAfricanAlaska NativeAlaskan AthabascanAlbanianAleutAlsatianAmericanApacheArabArapahoArgentineanArmenianAssyrian/Chaldean/SyriacAustralianAustrianBahamianBangladeshiBarbadianBasqueBelgianBelizeanBermudanBhutaneseBlackfeetBolivianBrazilianBritishBritish West IndianBulgarianBurmeseCajunCambodianCanadianCape VerdeanCarpatho RusynCelticCentral AmericanCentral American IndianCherokeeCheyenneChickasawChileanChineseChippewaChoctawColombianColvilleComancheCosta RicanCreeCreekCroatianCrowCubanCypriotCzechCzechoslovakianDanishDelawareDominicanDutchDutch West IndianEastern EuropeanEcuadorianEgyptianEnglishEstonianEthiopianEuropeanFijianFilipinoFinnishFrenchFrench American IndianFrench CanadianGermanGerman RussianGhanaianGreekGuamanian/ChamorroGuatemalanGuyaneseHaitianHmongHonduranHopiHoumaHungarianIcelanderIndian (Asian)IndonesianInupiatIranianIraqiIrishIroquoisIsraeliItalianJamaicanJapaneseJordanianKenyanKiowaKoreanLaotianLatvianLebaneseLiberianLithuanianLumbeeLuxembourgerMacedonianMalaysianMalteseMarshalleseMenomineeMexicanMexican American IndianMongolianMoroccanNative HawaiianNavajoNepaleseNew ZealanderNicaraguanNigerianNorthern EuropeanNorwegianOkinawanOsageOttawaPaiutePakistaniPalestinianPanamanianParaguayanPennsylvania GermanPeruvianPimaPolishPortuguesePotawatomiPuebloPuerto RicanPuget Sound SalishRomanianRussianSalvadoranSamoanScandinavianScotch-IrishScottishSeminoleSenegaleseSerbianShoshoneSierra LeoneanSiouxSlavicSlovakSloveneSomaliSouth AfricanSouth AmericanSouth American IndianSoviet UnionSpaniardSpanishSpanish AmericanSpanish American IndianSri LankanSubsaharan AfricanSudaneseSwedishSwissSyrianTaiwaneseThaiTlingit-HaidaTohono O'OdhamTonganTrinidadian and TobagonianTsimshianTurkishU.S. Virgin IslanderUgandanUkrainianUruguayanUteVenezuelanVietnameseWelshWest IndianYakamaYaquiYugoslavianYumanYup'ikZimbabwean
Immigration
NonimmigrantsImmigrantsAfghanistanAfricaAlbaniaArgentinaArmeniaAsiaAustraliaAustriaBahamasBangladeshBarbadosBelarusBelgiumBelizeBoliviaBosnia and HerzegovinaBrazilBulgariaBurma/MyanmarCabo VerdeCambodiaCameroonCanadaCaribbeanCentral AmericaChileChinaColombiaCongoCosta RicaCroatiaCubaCzechoslovakiaDenmarkDominicaDominican RepublicEastern AfricaEastern AsiaEastern EuropeEcuadorEgyptEl SalvadorEnglandEritreaEthiopiaEuropeFijiFranceGermanyGhanaGreeceGrenadaGuatemalaGuyanaHaitiHondurasHong KongHungaryIndiaIndonesiaIranIraqIrelandIsraelItalyJamaicaJapanJordanKazakhstanKenyaKoreaKuwaitLaosLatin AmericaLatviaLebanonLiberiaLithuaniaMalaysiaMexicoMicronesiaMiddle AfricaMoldovaMoroccoNepalNetherlandsNicaraguaNigeriaNorth AmericaNorth MacedoniaNorthern AfricaNorthern EuropeNorwayOceaniaPakistanPanamaPeruPhilippinesPolandPortugalRomaniaRussiaSaudi ArabiaScotlandSenegalSerbiaSierra LeoneSingaporeSomaliaSouth AfricaSouth AmericaSouth Central AsiaSouth Eastern AsiaSouthern EuropeSpainSri LankaSt. Vincent and the GrenadinesSudanSwedenSwitzerlandSyriaTaiwanThailandTrinidad and TobagoTurkeyUgandaUkraineUruguayUzbekistanVenezuelaVietnamWest IndiesWestern AsiaWestern EuropeYemenZaireZimbabweAzores
Single Father Poverty
Income
Poverty
Unemployment
Labor Participation
Family Structure
Vehicle Availability
Education Level
Disability

Single Father Poverty Comparison

Immigrants from Western Africa

Immigrants from Croatia

Fair
Poor
16.4%
SINGLE FATHER POVERTY
36.0/ 100
METRIC RATING
181st/ 347
METRIC RANK
16.6%
SINGLE FATHER POVERTY
16.5/ 100
METRIC RATING
202nd/ 347
METRIC RANK

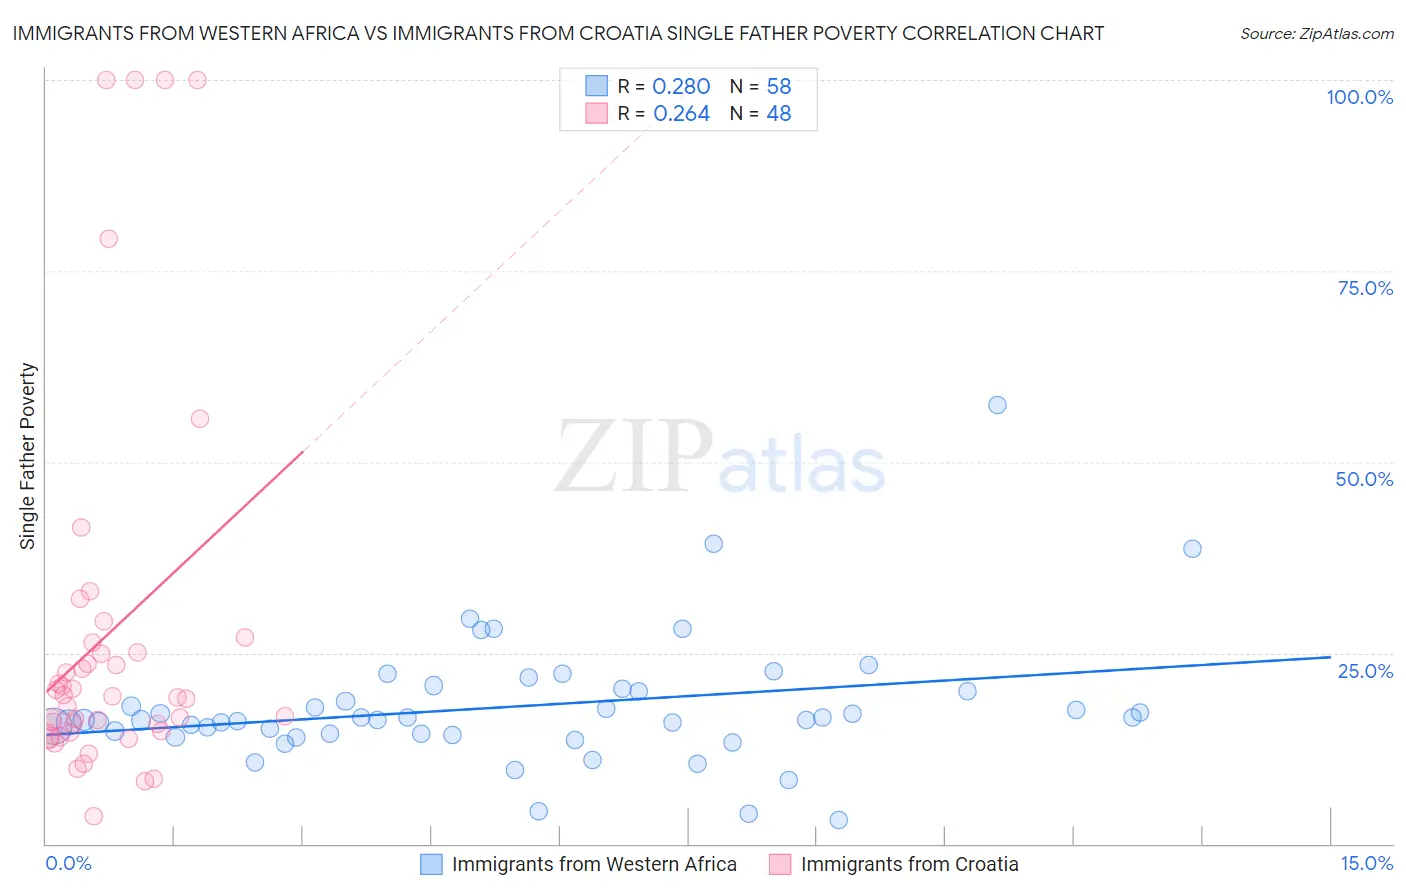
Immigrants from Western Africa vs Immigrants from Croatia Single Father Poverty Correlation Chart

The statistical analysis conducted on geographies consisting of 289,916,705 people shows a weak positive correlation between the proportion of Immigrants from Western Africa and poverty level among single fathers in the United States with a correlation coefficient (R) of 0.280 and weighted average of 16.4%. Similarly, the statistical analysis conducted on geographies consisting of 114,910,153 people shows a weak positive correlation between the proportion of Immigrants from Croatia and poverty level among single fathers in the United States with a correlation coefficient (R) of 0.264 and weighted average of 16.6%, a difference of 1.1%.
Immigrants from Western Africa vs Immigrants from Croatia Single Father Poverty

Single Father Poverty Correlation Summary

MeasurementImmigrants from Western AfricaImmigrants from Croatia
Minimum3.1%3.6%
Maximum57.4%100.0%
Range54.4%96.4%
Mean18.0%27.6%
Median16.2%19.2%
Interquartile 25% (IQ1)14.4%14.7%
Interquartile 75% (IQ3)20.0%25.6%
Interquartile Range (IQR)5.5%11.0%
Standard Deviation (Sample)8.5%25.2%
Standard Deviation (Population)8.5%24.9%

Similar Demographics by Single Father Poverty

Demographics Similar to Immigrants from Western Africa by Single Father Poverty

In terms of single father poverty, the demographic groups most similar to Immigrants from Western Africa are Immigrants from Italy (16.4%, a difference of 0.010%), Aleut (16.4%, a difference of 0.030%), Immigrants from Latin America (16.4%, a difference of 0.060%), Cambodian (16.4%, a difference of 0.060%), and Panamanian (16.4%, a difference of 0.12%).
DemographicsRating | RankSingle Father Poverty
Swedes
50.0
/100
|
#174
Average
16.3%
Immigrants | Ecuador
49.7
/100
|
#175
Average
16.3%
Vietnamese
48.0
/100
|
#176
Average
16.3%
Immigrants | South Africa
44.2
/100
|
#177
Average
16.3%
Immigrants | Cuba
41.6
/100
|
#178
Average
16.4%
Serbians
40.9
/100
|
#179
Average
16.4%
Immigrants | Latin America
37.2
/100
|
#180
Fair
16.4%
Immigrants | Western Africa
36.0
/100
|
#181
Fair
16.4%
Immigrants | Italy
35.7
/100
|
#182
Fair
16.4%
Aleuts
35.3
/100
|
#183
Fair
16.4%
Cambodians
34.6
/100
|
#184
Fair
16.4%
Panamanians
33.6
/100
|
#185
Fair
16.4%
Immigrants | Venezuela
31.0
/100
|
#186
Fair
16.4%
Ukrainians
30.4
/100
|
#187
Fair
16.4%
Russians
30.1
/100
|
#188
Fair
16.4%

Demographics Similar to Immigrants from Croatia by Single Father Poverty

In terms of single father poverty, the demographic groups most similar to Immigrants from Croatia are Cuban (16.6%, a difference of 0.0%), Syrian (16.6%, a difference of 0.070%), Immigrants from North America (16.6%, a difference of 0.11%), Immigrants from Guatemala (16.6%, a difference of 0.14%), and Venezuelan (16.6%, a difference of 0.19%).
DemographicsRating | RankSingle Father Poverty
Immigrants | Barbados
24.3
/100
|
#195
Fair
16.5%
Immigrants | Canada
21.9
/100
|
#196
Fair
16.5%
Immigrants | Northern Europe
20.3
/100
|
#197
Fair
16.5%
Romanians
20.1
/100
|
#198
Fair
16.5%
Immigrants | Belize
19.8
/100
|
#199
Poor
16.5%
Syrians
17.4
/100
|
#200
Poor
16.6%
Cubans
16.5
/100
|
#201
Poor
16.6%
Immigrants | Croatia
16.5
/100
|
#202
Poor
16.6%
Immigrants | North America
15.1
/100
|
#203
Poor
16.6%
Immigrants | Guatemala
14.8
/100
|
#204
Poor
16.6%
Venezuelans
14.3
/100
|
#205
Poor
16.6%
Immigrants | Senegal
13.7
/100
|
#206
Poor
16.6%
New Zealanders
13.7
/100
|
#207
Poor
16.6%
Eastern Europeans
13.7
/100
|
#208
Poor
16.6%
Europeans
13.2
/100
|
#209
Poor
16.6%