Nigerian vs Immigrants from Croatia Single Father Poverty
COMPARE
Nigerian
Immigrants from Croatia
Single Father Poverty
Single Father Poverty Comparison
Nigerians
Immigrants from Croatia
16.1%
SINGLE FATHER POVERTY
76.8/ 100
METRIC RATING
148th/ 347
METRIC RANK
16.6%
SINGLE FATHER POVERTY
16.5/ 100
METRIC RATING
202nd/ 347
METRIC RANK
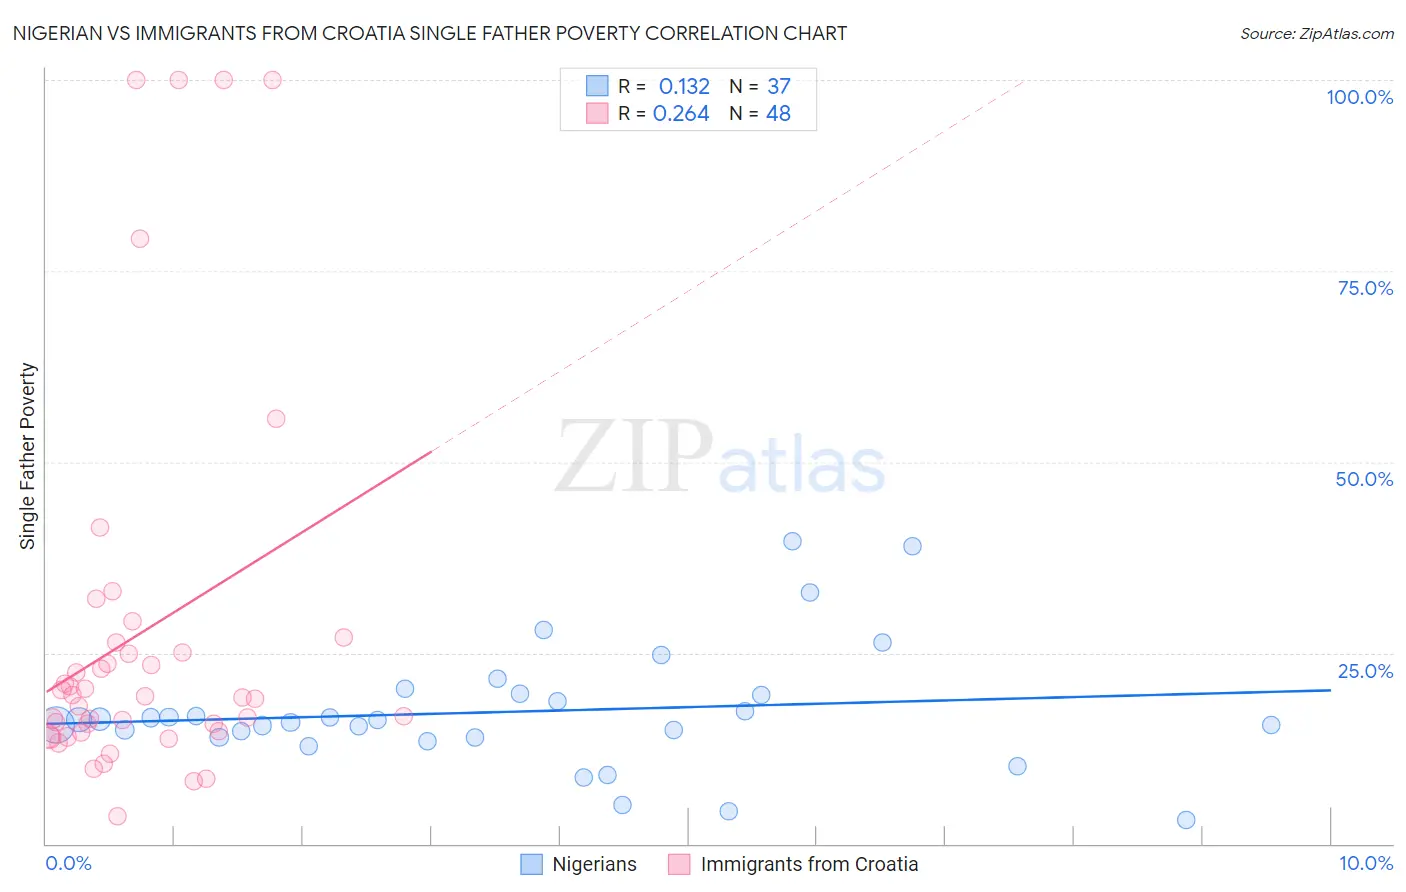
Nigerian vs Immigrants from Croatia Single Father Poverty Correlation Chart
The statistical analysis conducted on geographies consisting of 274,896,002 people shows a poor positive correlation between the proportion of Nigerians and poverty level among single fathers in the United States with a correlation coefficient (R) of 0.132 and weighted average of 16.1%. Similarly, the statistical analysis conducted on geographies consisting of 114,910,153 people shows a weak positive correlation between the proportion of Immigrants from Croatia and poverty level among single fathers in the United States with a correlation coefficient (R) of 0.264 and weighted average of 16.6%, a difference of 3.2%.
Single Father Poverty Correlation Summary
| Measurement | Nigerian | Immigrants from Croatia |
| Minimum | 3.1% | 3.6% |
| Maximum | 39.7% | 100.0% |
| Range | 36.6% | 96.4% |
| Mean | 17.3% | 27.6% |
| Median | 16.2% | 19.2% |
| Interquartile 25% (IQ1) | 13.9% | 14.7% |
| Interquartile 75% (IQ3) | 19.6% | 25.6% |
| Interquartile Range (IQR) | 5.7% | 11.0% |
| Standard Deviation (Sample) | 8.0% | 25.2% |
| Standard Deviation (Population) | 7.9% | 24.9% |
Similar Demographics by Single Father Poverty
Demographics Similar to Nigerians by Single Father Poverty
In terms of single father poverty, the demographic groups most similar to Nigerians are Colombian (16.1%, a difference of 0.020%), Immigrants from Hungary (16.1%, a difference of 0.10%), South African (16.1%, a difference of 0.10%), Jordanian (16.1%, a difference of 0.16%), and Immigrants from France (16.1%, a difference of 0.22%).
| Demographics | Rating | Rank | Single Father Poverty |
| Liberians | 83.3 /100 | #141 | Excellent 16.0% |
| Immigrants | Mexico | 83.3 /100 | #142 | Excellent 16.0% |
| Immigrants | Central America | 83.1 /100 | #143 | Excellent 16.0% |
| Immigrants | Kuwait | 81.4 /100 | #144 | Excellent 16.0% |
| Immigrants | Western Asia | 80.7 /100 | #145 | Excellent 16.0% |
| Immigrants | Hungary | 78.3 /100 | #146 | Good 16.1% |
| Colombians | 77.1 /100 | #147 | Good 16.1% |
| Nigerians | 76.8 /100 | #148 | Good 16.1% |
| South Africans | 75.1 /100 | #149 | Good 16.1% |
| Jordanians | 74.2 /100 | #150 | Good 16.1% |
| Immigrants | France | 73.1 /100 | #151 | Good 16.1% |
| Immigrants | Zimbabwe | 72.1 /100 | #152 | Good 16.1% |
| Immigrants | Israel | 72.0 /100 | #153 | Good 16.1% |
| Mexicans | 70.1 /100 | #154 | Good 16.1% |
| Immigrants | Nicaragua | 67.8 /100 | #155 | Good 16.2% |
Demographics Similar to Immigrants from Croatia by Single Father Poverty
In terms of single father poverty, the demographic groups most similar to Immigrants from Croatia are Cuban (16.6%, a difference of 0.0%), Syrian (16.6%, a difference of 0.070%), Immigrants from North America (16.6%, a difference of 0.11%), Immigrants from Guatemala (16.6%, a difference of 0.14%), and Venezuelan (16.6%, a difference of 0.19%).
| Demographics | Rating | Rank | Single Father Poverty |
| Immigrants | Barbados | 24.3 /100 | #195 | Fair 16.5% |
| Immigrants | Canada | 21.9 /100 | #196 | Fair 16.5% |
| Immigrants | Northern Europe | 20.3 /100 | #197 | Fair 16.5% |
| Romanians | 20.1 /100 | #198 | Fair 16.5% |
| Immigrants | Belize | 19.8 /100 | #199 | Poor 16.5% |
| Syrians | 17.4 /100 | #200 | Poor 16.6% |
| Cubans | 16.5 /100 | #201 | Poor 16.6% |
| Immigrants | Croatia | 16.5 /100 | #202 | Poor 16.6% |
| Immigrants | North America | 15.1 /100 | #203 | Poor 16.6% |
| Immigrants | Guatemala | 14.8 /100 | #204 | Poor 16.6% |
| Venezuelans | 14.3 /100 | #205 | Poor 16.6% |
| Immigrants | Senegal | 13.7 /100 | #206 | Poor 16.6% |
| New Zealanders | 13.7 /100 | #207 | Poor 16.6% |
| Eastern Europeans | 13.7 /100 | #208 | Poor 16.6% |
| Europeans | 13.2 /100 | #209 | Poor 16.6% |