Marshallese vs Immigrants from Croatia 5th Grade
COMPARE
Marshallese
Immigrants from Croatia
5th Grade
5th Grade Comparison
Marshallese
Immigrants from Croatia
97.4%
5TH GRADE
61.2/ 100
METRIC RATING
160th/ 347
METRIC RANK
97.6%
5TH GRADE
95.5/ 100
METRIC RATING
116th/ 347
METRIC RANK
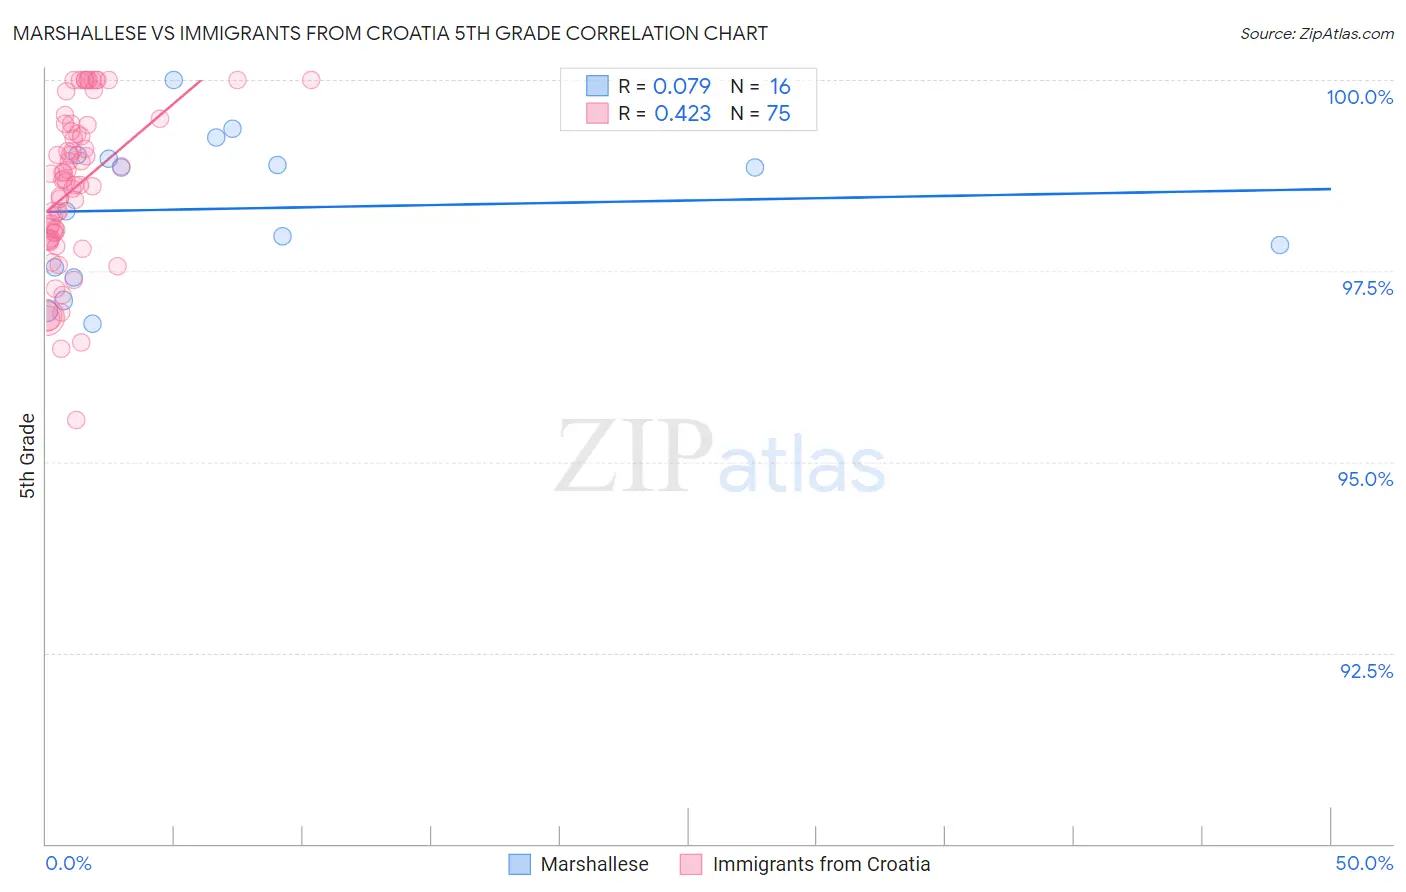
Marshallese vs Immigrants from Croatia 5th Grade Correlation Chart
The statistical analysis conducted on geographies consisting of 14,761,315 people shows a slight positive correlation between the proportion of Marshallese and percentage of population with at least 5th grade education in the United States with a correlation coefficient (R) of 0.079 and weighted average of 97.4%. Similarly, the statistical analysis conducted on geographies consisting of 132,508,207 people shows a moderate positive correlation between the proportion of Immigrants from Croatia and percentage of population with at least 5th grade education in the United States with a correlation coefficient (R) of 0.423 and weighted average of 97.6%, a difference of 0.27%.
5th Grade Correlation Summary
| Measurement | Marshallese | Immigrants from Croatia |
| Minimum | 96.8% | 95.5% |
| Maximum | 100.0% | 100.0% |
| Range | 3.2% | 4.5% |
| Mean | 98.3% | 98.6% |
| Median | 98.6% | 98.7% |
| Interquartile 25% (IQ1) | 97.5% | 97.9% |
| Interquartile 75% (IQ3) | 99.0% | 99.4% |
| Interquartile Range (IQR) | 1.5% | 1.5% |
| Standard Deviation (Sample) | 0.96% | 1.0% |
| Standard Deviation (Population) | 0.93% | 1.0% |
Similar Demographics by 5th Grade
Demographics Similar to Marshallese by 5th Grade
In terms of 5th grade, the demographic groups most similar to Marshallese are Kenyan (97.4%, a difference of 0.010%), Immigrants from Iran (97.4%, a difference of 0.010%), Ugandan (97.4%, a difference of 0.010%), Bermudan (97.4%, a difference of 0.010%), and Immigrants from Poland (97.4%, a difference of 0.010%).
| Demographics | Rating | Rank | 5th Grade |
| Alsatians | 74.3 /100 | #153 | Good 97.4% |
| Immigrants | Russia | 71.2 /100 | #154 | Good 97.4% |
| Immigrants | Bosnia and Herzegovina | 71.0 /100 | #155 | Good 97.4% |
| French American Indians | 70.5 /100 | #156 | Good 97.4% |
| Immigrants | Jordan | 70.4 /100 | #157 | Good 97.4% |
| Albanians | 68.3 /100 | #158 | Good 97.4% |
| Immigrants | Italy | 65.2 /100 | #159 | Good 97.4% |
| Marshallese | 61.2 /100 | #160 | Good 97.4% |
| Kenyans | 59.7 /100 | #161 | Average 97.4% |
| Immigrants | Iran | 59.5 /100 | #162 | Average 97.4% |
| Ugandans | 58.9 /100 | #163 | Average 97.4% |
| Bermudans | 58.8 /100 | #164 | Average 97.4% |
| Immigrants | Poland | 57.9 /100 | #165 | Average 97.4% |
| Apache | 57.2 /100 | #166 | Average 97.4% |
| Immigrants | Belarus | 54.6 /100 | #167 | Average 97.3% |
Demographics Similar to Immigrants from Croatia by 5th Grade
In terms of 5th grade, the demographic groups most similar to Immigrants from Croatia are Lebanese (97.6%, a difference of 0.0%), Okinawan (97.6%, a difference of 0.0%), Immigrants from Saudi Arabia (97.6%, a difference of 0.0%), Immigrants from Switzerland (97.7%, a difference of 0.010%), and Iroquois (97.7%, a difference of 0.010%).
| Demographics | Rating | Rank | 5th Grade |
| Immigrants | Latvia | 97.1 /100 | #109 | Exceptional 97.7% |
| Thais | 96.9 /100 | #110 | Exceptional 97.7% |
| Menominee | 96.3 /100 | #111 | Exceptional 97.7% |
| Immigrants | Switzerland | 96.0 /100 | #112 | Exceptional 97.7% |
| Iroquois | 95.9 /100 | #113 | Exceptional 97.7% |
| Lebanese | 95.7 /100 | #114 | Exceptional 97.6% |
| Okinawans | 95.7 /100 | #115 | Exceptional 97.6% |
| Immigrants | Croatia | 95.5 /100 | #116 | Exceptional 97.6% |
| Immigrants | Saudi Arabia | 95.4 /100 | #117 | Exceptional 97.6% |
| Basques | 95.2 /100 | #118 | Exceptional 97.6% |
| Syrians | 95.1 /100 | #119 | Exceptional 97.6% |
| Immigrants | Zimbabwe | 94.9 /100 | #120 | Exceptional 97.6% |
| Immigrants | France | 94.8 /100 | #121 | Exceptional 97.6% |
| Immigrants | Japan | 94.7 /100 | #122 | Exceptional 97.6% |
| Immigrants | Norway | 94.6 /100 | #123 | Exceptional 97.6% |