German vs Egyptian Single Father Poverty
COMPARE
German
Egyptian
Single Father Poverty
Single Father Poverty Comparison
Germans
Egyptians
17.7%
SINGLE FATHER POVERTY
0.0/ 100
METRIC RATING
278th/ 347
METRIC RANK
14.7%
SINGLE FATHER POVERTY
100.0/ 100
METRIC RATING
34th/ 347
METRIC RANK
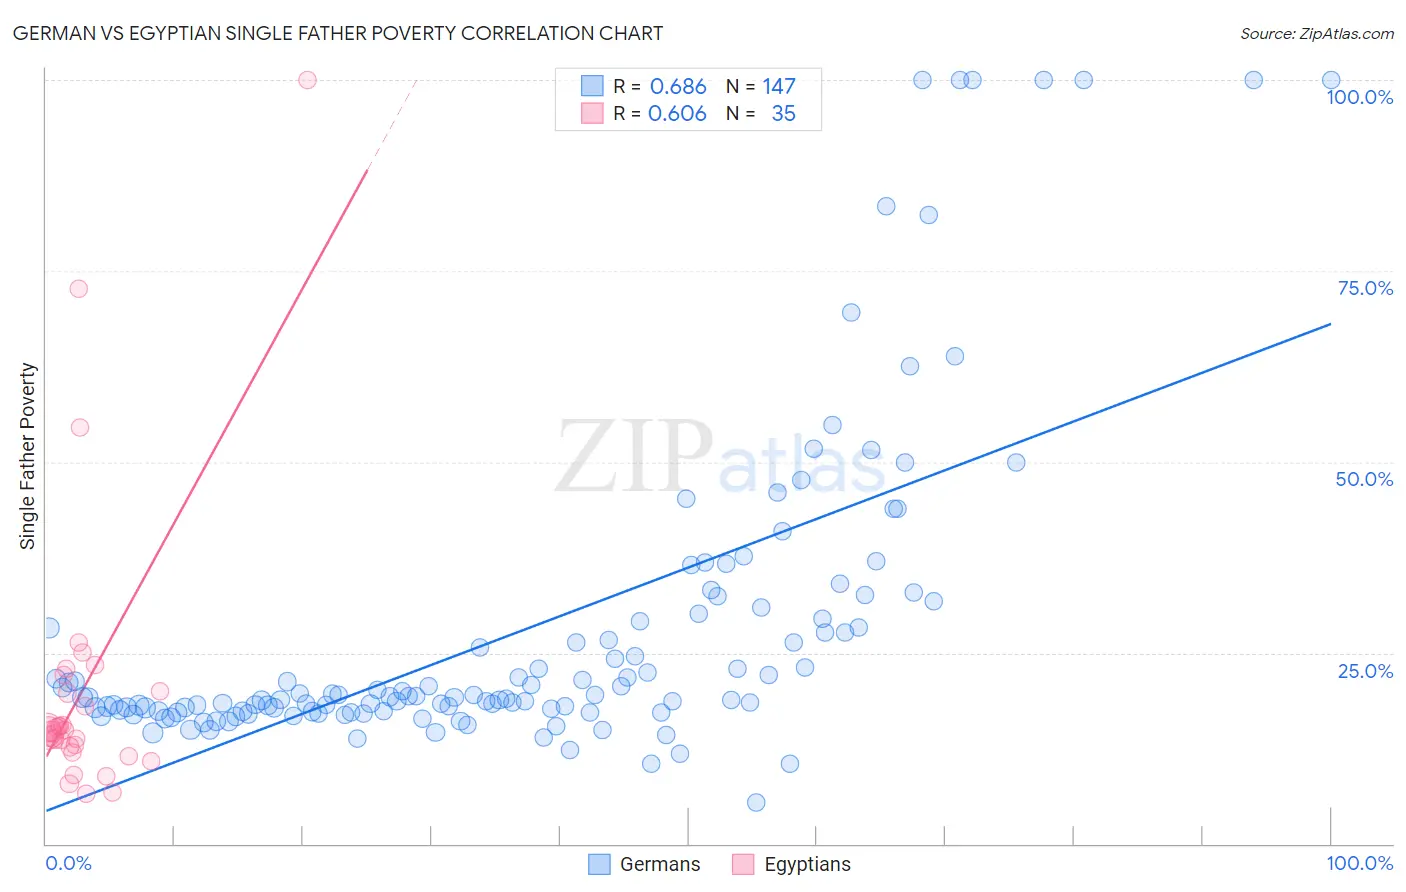
German vs Egyptian Single Father Poverty Correlation Chart
The statistical analysis conducted on geographies consisting of 412,171,316 people shows a significant positive correlation between the proportion of Germans and poverty level among single fathers in the United States with a correlation coefficient (R) of 0.686 and weighted average of 17.7%. Similarly, the statistical analysis conducted on geographies consisting of 226,846,927 people shows a significant positive correlation between the proportion of Egyptians and poverty level among single fathers in the United States with a correlation coefficient (R) of 0.606 and weighted average of 14.7%, a difference of 20.8%.
Single Father Poverty Correlation Summary
| Measurement | German | Egyptian |
| Minimum | 5.4% | 6.6% |
| Maximum | 100.0% | 100.0% |
| Range | 94.6% | 93.4% |
| Mean | 28.0% | 20.2% |
| Median | 19.2% | 14.8% |
| Interquartile 25% (IQ1) | 17.4% | 12.7% |
| Interquartile 75% (IQ3) | 29.5% | 20.0% |
| Interquartile Range (IQR) | 12.1% | 7.3% |
| Standard Deviation (Sample) | 20.7% | 18.7% |
| Standard Deviation (Population) | 20.6% | 18.5% |
Similar Demographics by Single Father Poverty
Demographics Similar to Germans by Single Father Poverty
In terms of single father poverty, the demographic groups most similar to Germans are Lebanese (17.7%, a difference of 0.010%), Iroquois (17.7%, a difference of 0.15%), German Russian (17.7%, a difference of 0.16%), Scottish (17.7%, a difference of 0.19%), and British West Indian (17.7%, a difference of 0.22%).
| Demographics | Rating | Rank | Single Father Poverty |
| French American Indians | 0.2 /100 | #271 | Tragic 17.4% |
| Barbadians | 0.1 /100 | #272 | Tragic 17.5% |
| Italians | 0.1 /100 | #273 | Tragic 17.5% |
| Macedonians | 0.1 /100 | #274 | Tragic 17.7% |
| British West Indians | 0.0 /100 | #275 | Tragic 17.7% |
| German Russians | 0.0 /100 | #276 | Tragic 17.7% |
| Lebanese | 0.0 /100 | #277 | Tragic 17.7% |
| Germans | 0.0 /100 | #278 | Tragic 17.7% |
| Iroquois | 0.0 /100 | #279 | Tragic 17.7% |
| Scottish | 0.0 /100 | #280 | Tragic 17.7% |
| English | 0.0 /100 | #281 | Tragic 17.8% |
| Dutch | 0.0 /100 | #282 | Tragic 17.8% |
| Alsatians | 0.0 /100 | #283 | Tragic 17.8% |
| Welsh | 0.0 /100 | #284 | Tragic 17.8% |
| Immigrants | Lebanon | 0.0 /100 | #285 | Tragic 17.9% |
Demographics Similar to Egyptians by Single Father Poverty
In terms of single father poverty, the demographic groups most similar to Egyptians are Immigrants from Bolivia (14.7%, a difference of 0.070%), Okinawan (14.6%, a difference of 0.10%), Immigrants from Indonesia (14.7%, a difference of 0.24%), Immigrants from Eastern Africa (14.7%, a difference of 0.36%), and Bolivian (14.7%, a difference of 0.37%).
| Demographics | Rating | Rank | Single Father Poverty |
| Nepalese | 100.0 /100 | #27 | Exceptional 14.4% |
| Immigrants | South Central Asia | 100.0 /100 | #28 | Exceptional 14.5% |
| Somalis | 100.0 /100 | #29 | Exceptional 14.5% |
| Thais | 100.0 /100 | #30 | Exceptional 14.5% |
| Icelanders | 100.0 /100 | #31 | Exceptional 14.5% |
| Asians | 100.0 /100 | #32 | Exceptional 14.6% |
| Okinawans | 100.0 /100 | #33 | Exceptional 14.6% |
| Egyptians | 100.0 /100 | #34 | Exceptional 14.7% |
| Immigrants | Bolivia | 100.0 /100 | #35 | Exceptional 14.7% |
| Immigrants | Indonesia | 100.0 /100 | #36 | Exceptional 14.7% |
| Immigrants | Eastern Africa | 100.0 /100 | #37 | Exceptional 14.7% |
| Bolivians | 100.0 /100 | #38 | Exceptional 14.7% |
| Immigrants | Asia | 100.0 /100 | #39 | Exceptional 14.7% |
| Pima | 100.0 /100 | #40 | Exceptional 14.8% |
| Indians (Asian) | 100.0 /100 | #41 | Exceptional 14.8% |