Croatian vs Egyptian Single Father Poverty
COMPARE
Croatian
Egyptian
Single Father Poverty
Single Father Poverty Comparison
Croatians
Egyptians
17.1%
SINGLE FATHER POVERTY
1.0/ 100
METRIC RATING
252nd/ 347
METRIC RANK
14.7%
SINGLE FATHER POVERTY
100.0/ 100
METRIC RATING
34th/ 347
METRIC RANK
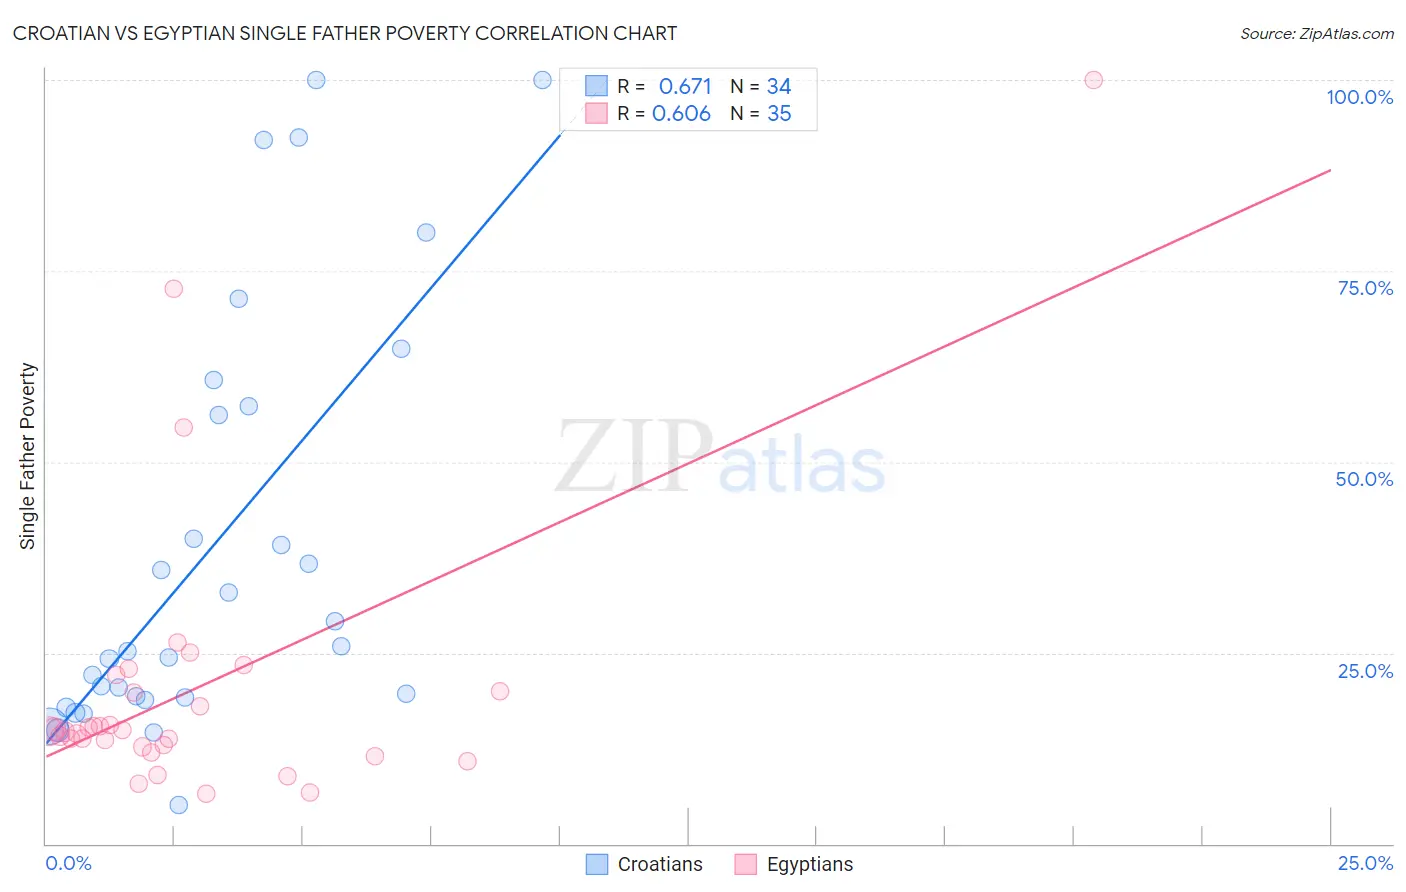
Croatian vs Egyptian Single Father Poverty Correlation Chart
The statistical analysis conducted on geographies consisting of 290,349,710 people shows a significant positive correlation between the proportion of Croatians and poverty level among single fathers in the United States with a correlation coefficient (R) of 0.671 and weighted average of 17.1%. Similarly, the statistical analysis conducted on geographies consisting of 226,846,927 people shows a significant positive correlation between the proportion of Egyptians and poverty level among single fathers in the United States with a correlation coefficient (R) of 0.606 and weighted average of 14.7%, a difference of 16.8%.
Single Father Poverty Correlation Summary
| Measurement | Croatian | Egyptian |
| Minimum | 5.0% | 6.6% |
| Maximum | 100.0% | 100.0% |
| Range | 95.0% | 93.4% |
| Mean | 39.1% | 20.2% |
| Median | 25.6% | 14.8% |
| Interquartile 25% (IQ1) | 19.1% | 12.7% |
| Interquartile 75% (IQ3) | 57.3% | 20.0% |
| Interquartile Range (IQR) | 38.2% | 7.3% |
| Standard Deviation (Sample) | 27.7% | 18.7% |
| Standard Deviation (Population) | 27.3% | 18.5% |
Similar Demographics by Single Father Poverty
Demographics Similar to Croatians by Single Father Poverty
In terms of single father poverty, the demographic groups most similar to Croatians are Cree (17.1%, a difference of 0.010%), Luxembourger (17.1%, a difference of 0.10%), Austrian (17.1%, a difference of 0.11%), Immigrants from Honduras (17.1%, a difference of 0.12%), and Canadian (17.1%, a difference of 0.24%).
| Demographics | Rating | Rank | Single Father Poverty |
| Trinidadians and Tobagonians | 1.5 /100 | #245 | Tragic 17.0% |
| Immigrants | Ireland | 1.4 /100 | #246 | Tragic 17.1% |
| Greeks | 1.3 /100 | #247 | Tragic 17.1% |
| Czechoslovakians | 1.3 /100 | #248 | Tragic 17.1% |
| Canadians | 1.3 /100 | #249 | Tragic 17.1% |
| Austrians | 1.1 /100 | #250 | Tragic 17.1% |
| Luxembourgers | 1.1 /100 | #251 | Tragic 17.1% |
| Croatians | 1.0 /100 | #252 | Tragic 17.1% |
| Cree | 1.0 /100 | #253 | Tragic 17.1% |
| Immigrants | Honduras | 0.9 /100 | #254 | Tragic 17.1% |
| Sierra Leoneans | 0.8 /100 | #255 | Tragic 17.2% |
| Immigrants | Haiti | 0.8 /100 | #256 | Tragic 17.2% |
| Immigrants | Albania | 0.7 /100 | #257 | Tragic 17.2% |
| Albanians | 0.7 /100 | #258 | Tragic 17.2% |
| Immigrants | Jamaica | 0.7 /100 | #259 | Tragic 17.2% |
Demographics Similar to Egyptians by Single Father Poverty
In terms of single father poverty, the demographic groups most similar to Egyptians are Immigrants from Bolivia (14.7%, a difference of 0.070%), Okinawan (14.6%, a difference of 0.10%), Immigrants from Indonesia (14.7%, a difference of 0.24%), Immigrants from Eastern Africa (14.7%, a difference of 0.36%), and Bolivian (14.7%, a difference of 0.37%).
| Demographics | Rating | Rank | Single Father Poverty |
| Nepalese | 100.0 /100 | #27 | Exceptional 14.4% |
| Immigrants | South Central Asia | 100.0 /100 | #28 | Exceptional 14.5% |
| Somalis | 100.0 /100 | #29 | Exceptional 14.5% |
| Thais | 100.0 /100 | #30 | Exceptional 14.5% |
| Icelanders | 100.0 /100 | #31 | Exceptional 14.5% |
| Asians | 100.0 /100 | #32 | Exceptional 14.6% |
| Okinawans | 100.0 /100 | #33 | Exceptional 14.6% |
| Egyptians | 100.0 /100 | #34 | Exceptional 14.7% |
| Immigrants | Bolivia | 100.0 /100 | #35 | Exceptional 14.7% |
| Immigrants | Indonesia | 100.0 /100 | #36 | Exceptional 14.7% |
| Immigrants | Eastern Africa | 100.0 /100 | #37 | Exceptional 14.7% |
| Bolivians | 100.0 /100 | #38 | Exceptional 14.7% |
| Immigrants | Asia | 100.0 /100 | #39 | Exceptional 14.7% |
| Pima | 100.0 /100 | #40 | Exceptional 14.8% |
| Indians (Asian) | 100.0 /100 | #41 | Exceptional 14.8% |