Spanish American Indian vs Egyptian Single Father Poverty
COMPARE
Spanish American Indian
Egyptian
Single Father Poverty
Single Father Poverty Comparison
Spanish American Indians
Egyptians
14.4%
SINGLE FATHER POVERTY
100.0/ 100
METRIC RATING
26th/ 347
METRIC RANK
14.7%
SINGLE FATHER POVERTY
100.0/ 100
METRIC RATING
34th/ 347
METRIC RANK
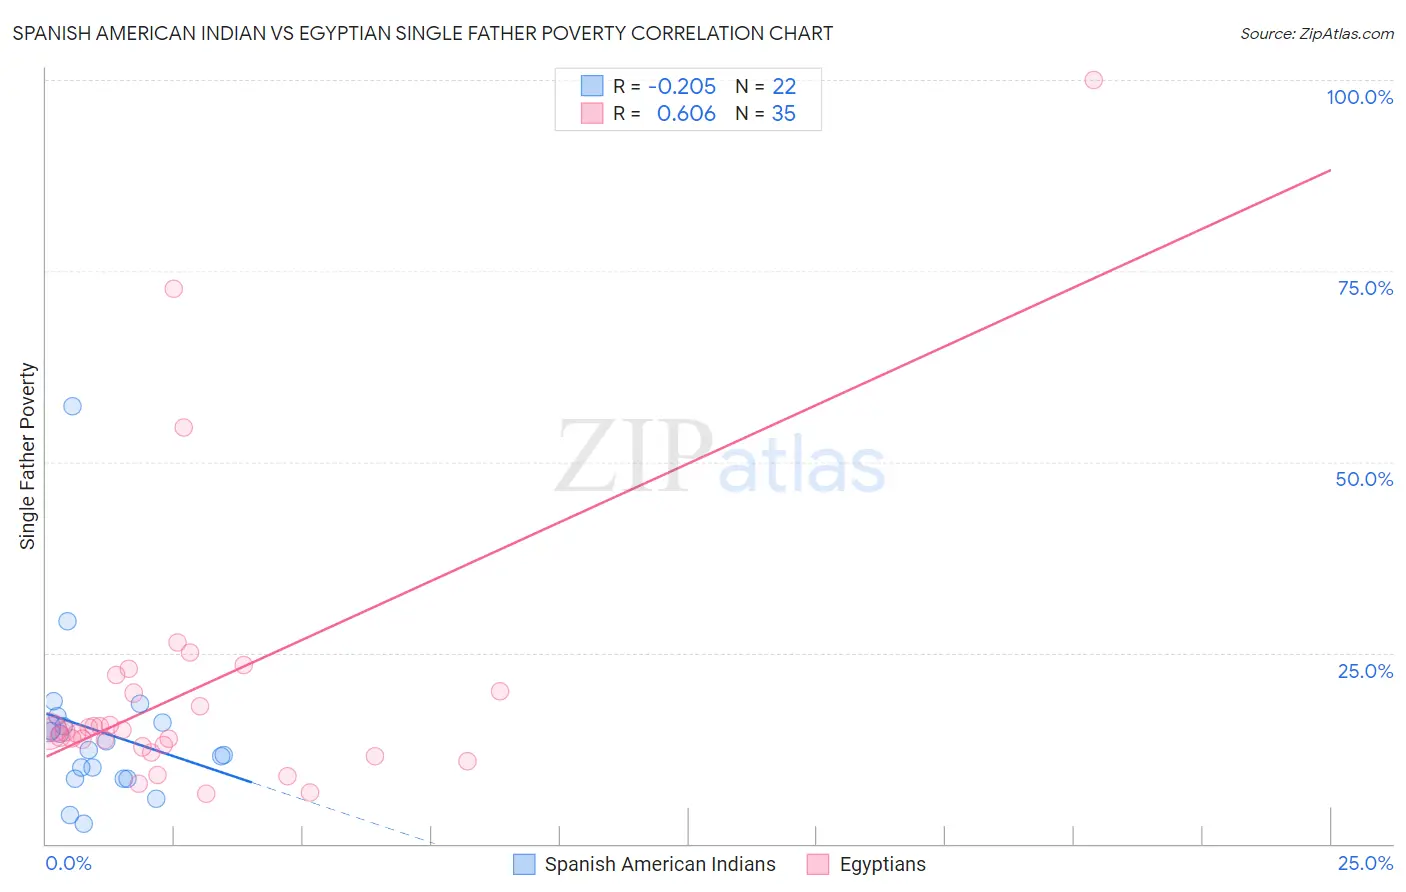
Spanish American Indian vs Egyptian Single Father Poverty Correlation Chart
The statistical analysis conducted on geographies consisting of 69,773,093 people shows a weak negative correlation between the proportion of Spanish American Indians and poverty level among single fathers in the United States with a correlation coefficient (R) of -0.205 and weighted average of 14.4%. Similarly, the statistical analysis conducted on geographies consisting of 226,846,927 people shows a significant positive correlation between the proportion of Egyptians and poverty level among single fathers in the United States with a correlation coefficient (R) of 0.606 and weighted average of 14.7%, a difference of 1.6%.
Single Father Poverty Correlation Summary
| Measurement | Spanish American Indian | Egyptian |
| Minimum | 2.6% | 6.6% |
| Maximum | 57.2% | 100.0% |
| Range | 54.6% | 93.4% |
| Mean | 14.6% | 20.2% |
| Median | 12.9% | 14.8% |
| Interquartile 25% (IQ1) | 8.5% | 12.7% |
| Interquartile 75% (IQ3) | 15.8% | 20.0% |
| Interquartile Range (IQR) | 7.3% | 7.3% |
| Standard Deviation (Sample) | 11.1% | 18.7% |
| Standard Deviation (Population) | 10.8% | 18.5% |
Demographics Similar to Spanish American Indians and Egyptians by Single Father Poverty
In terms of single father poverty, the demographic groups most similar to Spanish American Indians are Nepalese (14.4%, a difference of 0.050%), Iranian (14.4%, a difference of 0.42%), Immigrants from Egypt (14.4%, a difference of 0.46%), Immigrants from South Eastern Asia (14.4%, a difference of 0.46%), and Immigrants from South Central Asia (14.5%, a difference of 0.58%). Similarly, the demographic groups most similar to Egyptians are Immigrants from Bolivia (14.7%, a difference of 0.070%), Okinawan (14.6%, a difference of 0.10%), Immigrants from Indonesia (14.7%, a difference of 0.24%), Immigrants from Eastern Africa (14.7%, a difference of 0.36%), and Bolivian (14.7%, a difference of 0.37%).
| Demographics | Rating | Rank | Single Father Poverty |
| Immigrants | Singapore | 100.0 /100 | #20 | Exceptional 14.3% |
| Immigrants | Afghanistan | 100.0 /100 | #21 | Exceptional 14.3% |
| Taiwanese | 100.0 /100 | #22 | Exceptional 14.3% |
| Immigrants | Egypt | 100.0 /100 | #23 | Exceptional 14.4% |
| Immigrants | South Eastern Asia | 100.0 /100 | #24 | Exceptional 14.4% |
| Iranians | 100.0 /100 | #25 | Exceptional 14.4% |
| Spanish American Indians | 100.0 /100 | #26 | Exceptional 14.4% |
| Nepalese | 100.0 /100 | #27 | Exceptional 14.4% |
| Immigrants | South Central Asia | 100.0 /100 | #28 | Exceptional 14.5% |
| Somalis | 100.0 /100 | #29 | Exceptional 14.5% |
| Thais | 100.0 /100 | #30 | Exceptional 14.5% |
| Icelanders | 100.0 /100 | #31 | Exceptional 14.5% |
| Asians | 100.0 /100 | #32 | Exceptional 14.6% |
| Okinawans | 100.0 /100 | #33 | Exceptional 14.6% |
| Egyptians | 100.0 /100 | #34 | Exceptional 14.7% |
| Immigrants | Bolivia | 100.0 /100 | #35 | Exceptional 14.7% |
| Immigrants | Indonesia | 100.0 /100 | #36 | Exceptional 14.7% |
| Immigrants | Eastern Africa | 100.0 /100 | #37 | Exceptional 14.7% |
| Bolivians | 100.0 /100 | #38 | Exceptional 14.7% |
| Immigrants | Asia | 100.0 /100 | #39 | Exceptional 14.7% |
| Pima | 100.0 /100 | #40 | Exceptional 14.8% |