Malaysian vs Immigrants from Canada Female Poverty
COMPARE
Malaysian
Immigrants from Canada
Female Poverty
Female Poverty Comparison
Malaysians
Immigrants from Canada
14.3%
FEMALE POVERTY
7.4/ 100
METRIC RATING
210th/ 347
METRIC RANK
12.3%
FEMALE POVERTY
97.5/ 100
METRIC RATING
74th/ 347
METRIC RANK
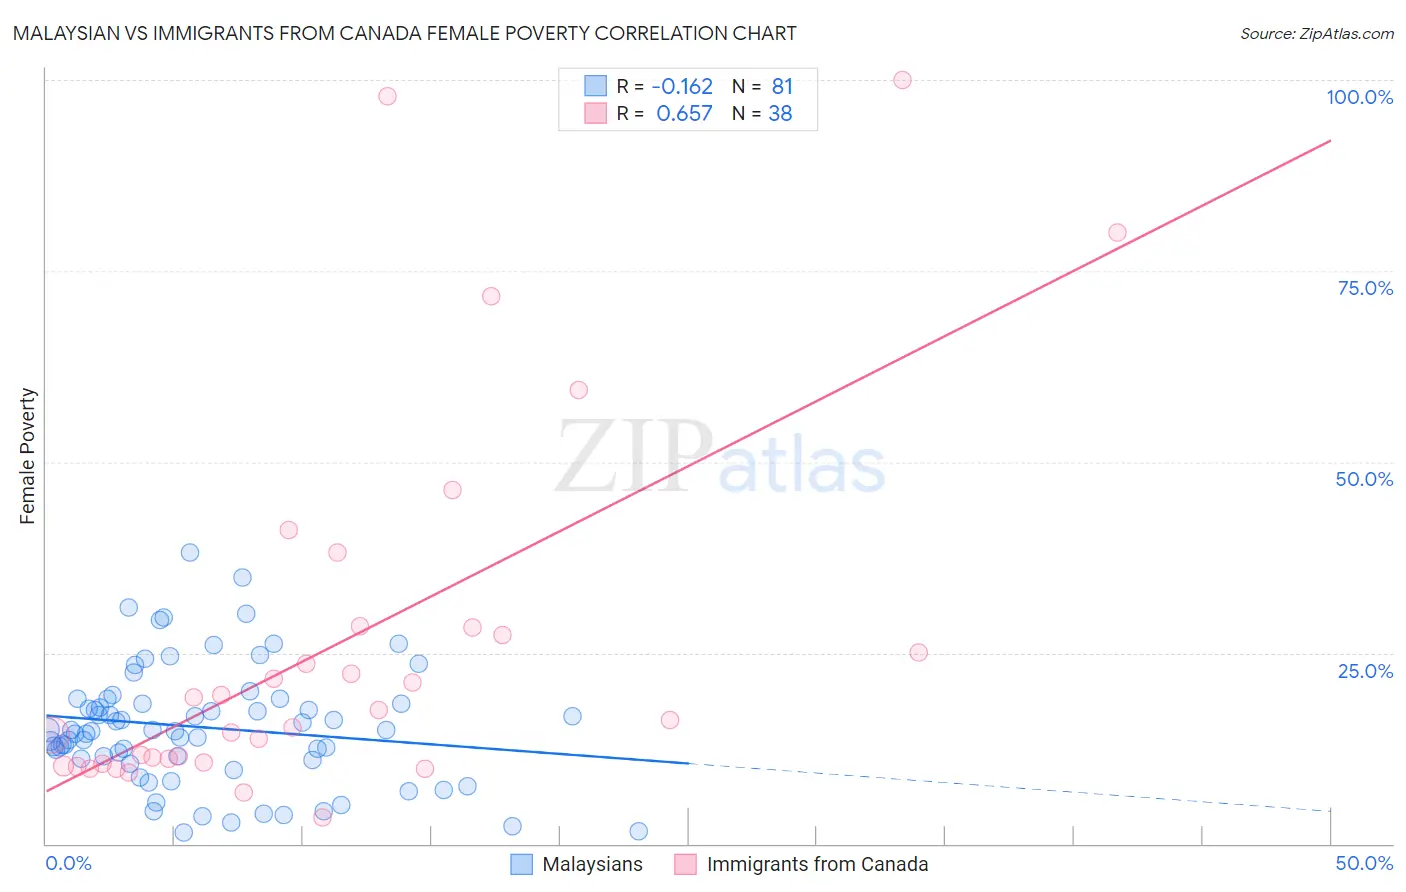
Malaysian vs Immigrants from Canada Female Poverty Correlation Chart
The statistical analysis conducted on geographies consisting of 225,983,571 people shows a poor negative correlation between the proportion of Malaysians and poverty level among females in the United States with a correlation coefficient (R) of -0.162 and weighted average of 14.3%. Similarly, the statistical analysis conducted on geographies consisting of 458,964,153 people shows a significant positive correlation between the proportion of Immigrants from Canada and poverty level among females in the United States with a correlation coefficient (R) of 0.657 and weighted average of 12.3%, a difference of 16.4%.
Female Poverty Correlation Summary
| Measurement | Malaysian | Immigrants from Canada |
| Minimum | 1.5% | 3.5% |
| Maximum | 38.2% | 100.0% |
| Range | 36.7% | 96.5% |
| Mean | 15.2% | 26.2% |
| Median | 14.8% | 16.9% |
| Interquartile 25% (IQ1) | 11.0% | 10.6% |
| Interquartile 75% (IQ3) | 18.7% | 28.3% |
| Interquartile Range (IQR) | 7.6% | 17.8% |
| Standard Deviation (Sample) | 7.8% | 24.5% |
| Standard Deviation (Population) | 7.7% | 24.2% |
Similar Demographics by Female Poverty
Demographics Similar to Malaysians by Female Poverty
In terms of female poverty, the demographic groups most similar to Malaysians are Panamanian (14.2%, a difference of 0.080%), Moroccan (14.3%, a difference of 0.080%), Immigrants from the Azores (14.2%, a difference of 0.15%), Immigrants from Eastern Africa (14.2%, a difference of 0.49%), and Bermudan (14.4%, a difference of 0.72%).
| Demographics | Rating | Rank | Female Poverty |
| Immigrants | Western Asia | 20.7 /100 | #203 | Fair 13.9% |
| Spaniards | 18.9 /100 | #204 | Poor 13.9% |
| Ugandans | 15.4 /100 | #205 | Poor 14.0% |
| Immigrants | Uruguay | 14.0 /100 | #206 | Poor 14.0% |
| Immigrants | Eastern Africa | 9.0 /100 | #207 | Tragic 14.2% |
| Immigrants | Azores | 7.9 /100 | #208 | Tragic 14.2% |
| Panamanians | 7.7 /100 | #209 | Tragic 14.2% |
| Malaysians | 7.4 /100 | #210 | Tragic 14.3% |
| Moroccans | 7.2 /100 | #211 | Tragic 14.3% |
| Bermudans | 5.5 /100 | #212 | Tragic 14.4% |
| Alaskan Athabascans | 5.3 /100 | #213 | Tragic 14.4% |
| Marshallese | 5.0 /100 | #214 | Tragic 14.4% |
| Immigrants | Panama | 4.7 /100 | #215 | Tragic 14.4% |
| Immigrants | Thailand | 4.5 /100 | #216 | Tragic 14.4% |
| Immigrants | Immigrants | 4.5 /100 | #217 | Tragic 14.4% |
Demographics Similar to Immigrants from Canada by Female Poverty
In terms of female poverty, the demographic groups most similar to Immigrants from Canada are Zimbabwean (12.3%, a difference of 0.010%), Cambodian (12.2%, a difference of 0.030%), Carpatho Rusyn (12.2%, a difference of 0.060%), European (12.3%, a difference of 0.12%), and Immigrants from Belgium (12.2%, a difference of 0.19%).
| Demographics | Rating | Rank | Female Poverty |
| Immigrants | Eastern Asia | 97.8 /100 | #67 | Exceptional 12.2% |
| Immigrants | Netherlands | 97.8 /100 | #68 | Exceptional 12.2% |
| Swiss | 97.7 /100 | #69 | Exceptional 12.2% |
| Immigrants | Belgium | 97.7 /100 | #70 | Exceptional 12.2% |
| Carpatho Rusyns | 97.6 /100 | #71 | Exceptional 12.2% |
| Cambodians | 97.5 /100 | #72 | Exceptional 12.2% |
| Zimbabweans | 97.5 /100 | #73 | Exceptional 12.3% |
| Immigrants | Canada | 97.5 /100 | #74 | Exceptional 12.3% |
| Europeans | 97.4 /100 | #75 | Exceptional 12.3% |
| Immigrants | Eastern Europe | 97.2 /100 | #76 | Exceptional 12.3% |
| Serbians | 97.2 /100 | #77 | Exceptional 12.3% |
| Egyptians | 97.2 /100 | #78 | Exceptional 12.3% |
| Immigrants | North America | 97.1 /100 | #79 | Exceptional 12.3% |
| Slovaks | 97.1 /100 | #80 | Exceptional 12.3% |
| Immigrants | Sweden | 97.1 /100 | #81 | Exceptional 12.3% |