Malaysian vs Immigrants from China Hearing Disability
COMPARE
Malaysian
Immigrants from China
Hearing Disability
Hearing Disability Comparison
Malaysians
Immigrants from China
3.2%
HEARING DISABILITY
6.6/ 100
METRIC RATING
220th/ 347
METRIC RANK
2.6%
HEARING DISABILITY
99.5/ 100
METRIC RATING
39th/ 347
METRIC RANK
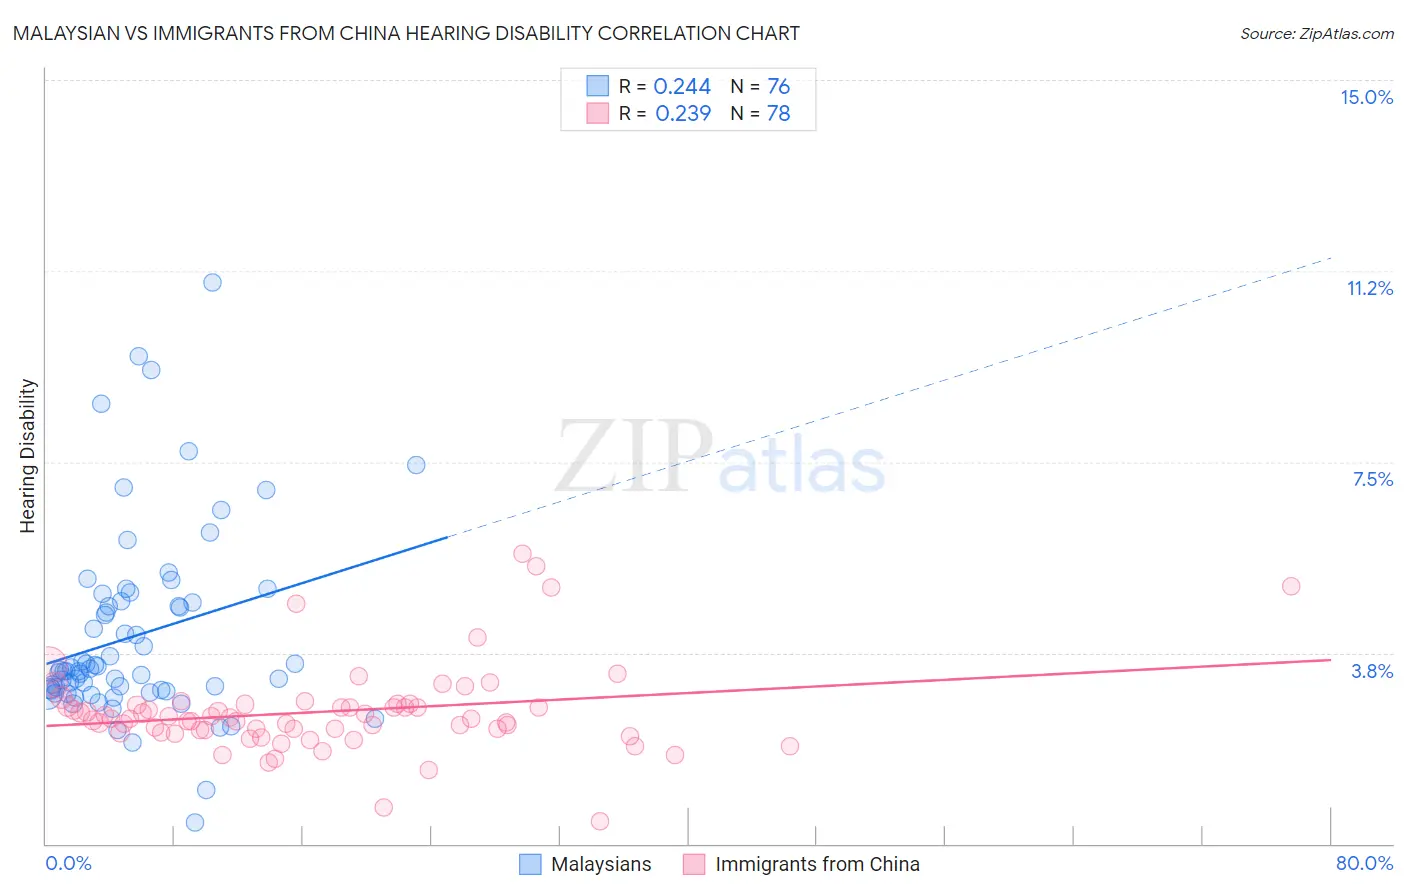
Malaysian vs Immigrants from China Hearing Disability Correlation Chart
The statistical analysis conducted on geographies consisting of 226,034,650 people shows a weak positive correlation between the proportion of Malaysians and percentage of population with hearing disability in the United States with a correlation coefficient (R) of 0.244 and weighted average of 3.2%. Similarly, the statistical analysis conducted on geographies consisting of 456,804,939 people shows a weak positive correlation between the proportion of Immigrants from China and percentage of population with hearing disability in the United States with a correlation coefficient (R) of 0.239 and weighted average of 2.6%, a difference of 21.2%.
Hearing Disability Correlation Summary
| Measurement | Malaysian | Immigrants from China |
| Minimum | 0.43% | 0.45% |
| Maximum | 11.0% | 5.7% |
| Range | 10.6% | 5.2% |
| Mean | 4.1% | 2.6% |
| Median | 3.4% | 2.5% |
| Interquartile 25% (IQ1) | 3.0% | 2.2% |
| Interquartile 75% (IQ3) | 4.8% | 2.7% |
| Interquartile Range (IQR) | 1.7% | 0.49% |
| Standard Deviation (Sample) | 1.9% | 0.87% |
| Standard Deviation (Population) | 1.9% | 0.86% |
Similar Demographics by Hearing Disability
Demographics Similar to Malaysians by Hearing Disability
In terms of hearing disability, the demographic groups most similar to Malaysians are Immigrants from Laos (3.2%, a difference of 0.0%), Immigrants from Oceania (3.2%, a difference of 0.040%), New Zealander (3.2%, a difference of 0.060%), Immigrants from Northern Europe (3.2%, a difference of 0.12%), and Russian (3.2%, a difference of 0.16%).
| Demographics | Rating | Rank | Hearing Disability |
| Immigrants | Iraq | 10.5 /100 | #213 | Poor 3.1% |
| Australians | 8.1 /100 | #214 | Tragic 3.2% |
| Bangladeshis | 8.1 /100 | #215 | Tragic 3.2% |
| Immigrants | Norway | 7.3 /100 | #216 | Tragic 3.2% |
| Russians | 7.1 /100 | #217 | Tragic 3.2% |
| Immigrants | Northern Europe | 7.0 /100 | #218 | Tragic 3.2% |
| New Zealanders | 6.8 /100 | #219 | Tragic 3.2% |
| Malaysians | 6.6 /100 | #220 | Tragic 3.2% |
| Immigrants | Laos | 6.6 /100 | #221 | Tragic 3.2% |
| Immigrants | Oceania | 6.5 /100 | #222 | Tragic 3.2% |
| Mexicans | 5.6 /100 | #223 | Tragic 3.2% |
| Icelanders | 5.2 /100 | #224 | Tragic 3.2% |
| Latvians | 5.1 /100 | #225 | Tragic 3.2% |
| Lebanese | 5.0 /100 | #226 | Tragic 3.2% |
| Bhutanese | 4.6 /100 | #227 | Tragic 3.2% |
Demographics Similar to Immigrants from China by Hearing Disability
In terms of hearing disability, the demographic groups most similar to Immigrants from China are Haitian (2.6%, a difference of 0.080%), Immigrants from Jamaica (2.6%, a difference of 0.24%), Immigrants from Western Africa (2.6%, a difference of 0.32%), Okinawan (2.6%, a difference of 0.35%), and Immigrants from Taiwan (2.6%, a difference of 0.42%).
| Demographics | Rating | Rank | Hearing Disability |
| Immigrants | Venezuela | 99.7 /100 | #32 | Exceptional 2.6% |
| Filipinos | 99.6 /100 | #33 | Exceptional 2.6% |
| Immigrants | Pakistan | 99.6 /100 | #34 | Exceptional 2.6% |
| Salvadorans | 99.6 /100 | #35 | Exceptional 2.6% |
| Okinawans | 99.6 /100 | #36 | Exceptional 2.6% |
| Immigrants | Western Africa | 99.6 /100 | #37 | Exceptional 2.6% |
| Immigrants | Jamaica | 99.5 /100 | #38 | Exceptional 2.6% |
| Immigrants | China | 99.5 /100 | #39 | Exceptional 2.6% |
| Haitians | 99.5 /100 | #40 | Exceptional 2.6% |
| Immigrants | Taiwan | 99.4 /100 | #41 | Exceptional 2.6% |
| West Indians | 99.4 /100 | #42 | Exceptional 2.6% |
| Senegalese | 99.4 /100 | #43 | Exceptional 2.6% |
| Nigerians | 99.4 /100 | #44 | Exceptional 2.6% |
| Venezuelans | 99.4 /100 | #45 | Exceptional 2.6% |
| Immigrants | Dominica | 99.3 /100 | #46 | Exceptional 2.6% |