Luxembourger vs Immigrants from Singapore Average Family Size
COMPARE
Luxembourger
Immigrants from Singapore
Average Family Size
Average Family Size Comparison
Luxembourgers
Immigrants from Singapore
3.10
AVERAGE FAMILY SIZE
0.0/ 100
METRIC RATING
335th/ 347
METRIC RANK
3.16
AVERAGE FAMILY SIZE
0.7/ 100
METRIC RATING
269th/ 347
METRIC RANK
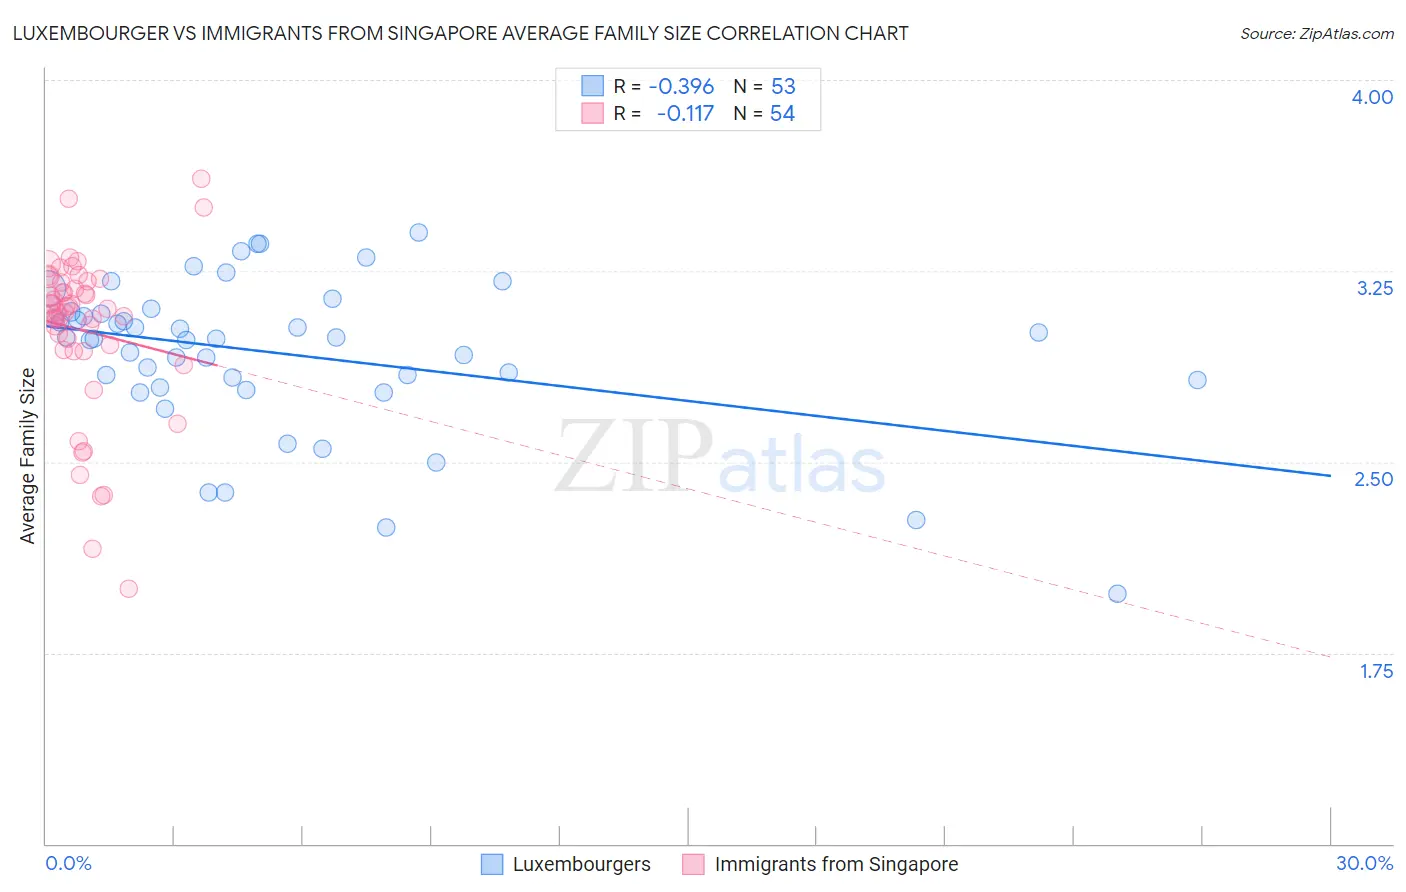
Luxembourger vs Immigrants from Singapore Average Family Size Correlation Chart
The statistical analysis conducted on geographies consisting of 144,654,567 people shows a mild negative correlation between the proportion of Luxembourgers and average family size in the United States with a correlation coefficient (R) of -0.396 and weighted average of 3.10. Similarly, the statistical analysis conducted on geographies consisting of 137,456,280 people shows a poor negative correlation between the proportion of Immigrants from Singapore and average family size in the United States with a correlation coefficient (R) of -0.117 and weighted average of 3.16, a difference of 1.7%.
Average Family Size Correlation Summary
| Measurement | Luxembourger | Immigrants from Singapore |
| Minimum | 1.98 | 2.00 |
| Maximum | 3.40 | 3.61 |
| Range | 1.42 | 1.61 |
| Mean | 2.92 | 3.02 |
| Median | 2.98 | 3.09 |
| Interquartile 25% (IQ1) | 2.81 | 2.94 |
| Interquartile 75% (IQ3) | 3.09 | 3.20 |
| Interquartile Range (IQR) | 0.28 | 0.27 |
| Standard Deviation (Sample) | 0.30 | 0.32 |
| Standard Deviation (Population) | 0.30 | 0.32 |
Similar Demographics by Average Family Size
Demographics Similar to Luxembourgers by Average Family Size
In terms of average family size, the demographic groups most similar to Luxembourgers are Estonian (3.10, a difference of 0.030%), Lithuanian (3.10, a difference of 0.030%), Irish (3.10, a difference of 0.060%), Scotch-Irish (3.11, a difference of 0.080%), and Scottish (3.11, a difference of 0.080%).
| Demographics | Rating | Rank | Average Family Size |
| Czechs | 0.0 /100 | #328 | Tragic 3.11 |
| Belgians | 0.0 /100 | #329 | Tragic 3.11 |
| Latvians | 0.0 /100 | #330 | Tragic 3.11 |
| Scotch-Irish | 0.0 /100 | #331 | Tragic 3.11 |
| Scottish | 0.0 /100 | #332 | Tragic 3.11 |
| Estonians | 0.0 /100 | #333 | Tragic 3.10 |
| Lithuanians | 0.0 /100 | #334 | Tragic 3.10 |
| Luxembourgers | 0.0 /100 | #335 | Tragic 3.10 |
| Irish | 0.0 /100 | #336 | Tragic 3.10 |
| Swedes | 0.0 /100 | #337 | Tragic 3.10 |
| French | 0.0 /100 | #338 | Tragic 3.10 |
| Croatians | 0.0 /100 | #339 | Tragic 3.10 |
| Finns | 0.0 /100 | #340 | Tragic 3.09 |
| Poles | 0.0 /100 | #341 | Tragic 3.09 |
| Germans | 0.0 /100 | #342 | Tragic 3.09 |
Demographics Similar to Immigrants from Singapore by Average Family Size
In terms of average family size, the demographic groups most similar to Immigrants from Singapore are Maltese (3.16, a difference of 0.010%), Tlingit-Haida (3.16, a difference of 0.030%), Iroquois (3.16, a difference of 0.050%), Immigrants from Germany (3.15, a difference of 0.050%), and Immigrants from Greece (3.16, a difference of 0.070%).
| Demographics | Rating | Rank | Average Family Size |
| Immigrants | Russia | 1.3 /100 | #262 | Tragic 3.16 |
| Immigrants | Bulgaria | 1.0 /100 | #263 | Tragic 3.16 |
| Americans | 1.0 /100 | #264 | Tragic 3.16 |
| Immigrants | South Africa | 0.9 /100 | #265 | Tragic 3.16 |
| Immigrants | Greece | 0.9 /100 | #266 | Tragic 3.16 |
| Iroquois | 0.8 /100 | #267 | Tragic 3.16 |
| Maltese | 0.8 /100 | #268 | Tragic 3.16 |
| Immigrants | Singapore | 0.7 /100 | #269 | Tragic 3.16 |
| Tlingit-Haida | 0.7 /100 | #270 | Tragic 3.16 |
| Immigrants | Germany | 0.7 /100 | #271 | Tragic 3.15 |
| Immigrants | Lithuania | 0.6 /100 | #272 | Tragic 3.15 |
| New Zealanders | 0.6 /100 | #273 | Tragic 3.15 |
| Immigrants | Belgium | 0.6 /100 | #274 | Tragic 3.15 |
| Cambodians | 0.6 /100 | #275 | Tragic 3.15 |
| Immigrants | Bosnia and Herzegovina | 0.5 /100 | #276 | Tragic 3.15 |