Luxembourger vs Immigrants from Micronesia Receiving Food Stamps
COMPARE
Luxembourger
Immigrants from Micronesia
Receiving Food Stamps
Receiving Food Stamps Comparison
Luxembourgers
Immigrants from Micronesia
9.1%
RECEIVING FOOD STAMPS
99.8/ 100
METRIC RATING
21st/ 347
METRIC RANK
13.5%
RECEIVING FOOD STAMPS
1.3/ 100
METRIC RATING
239th/ 347
METRIC RANK
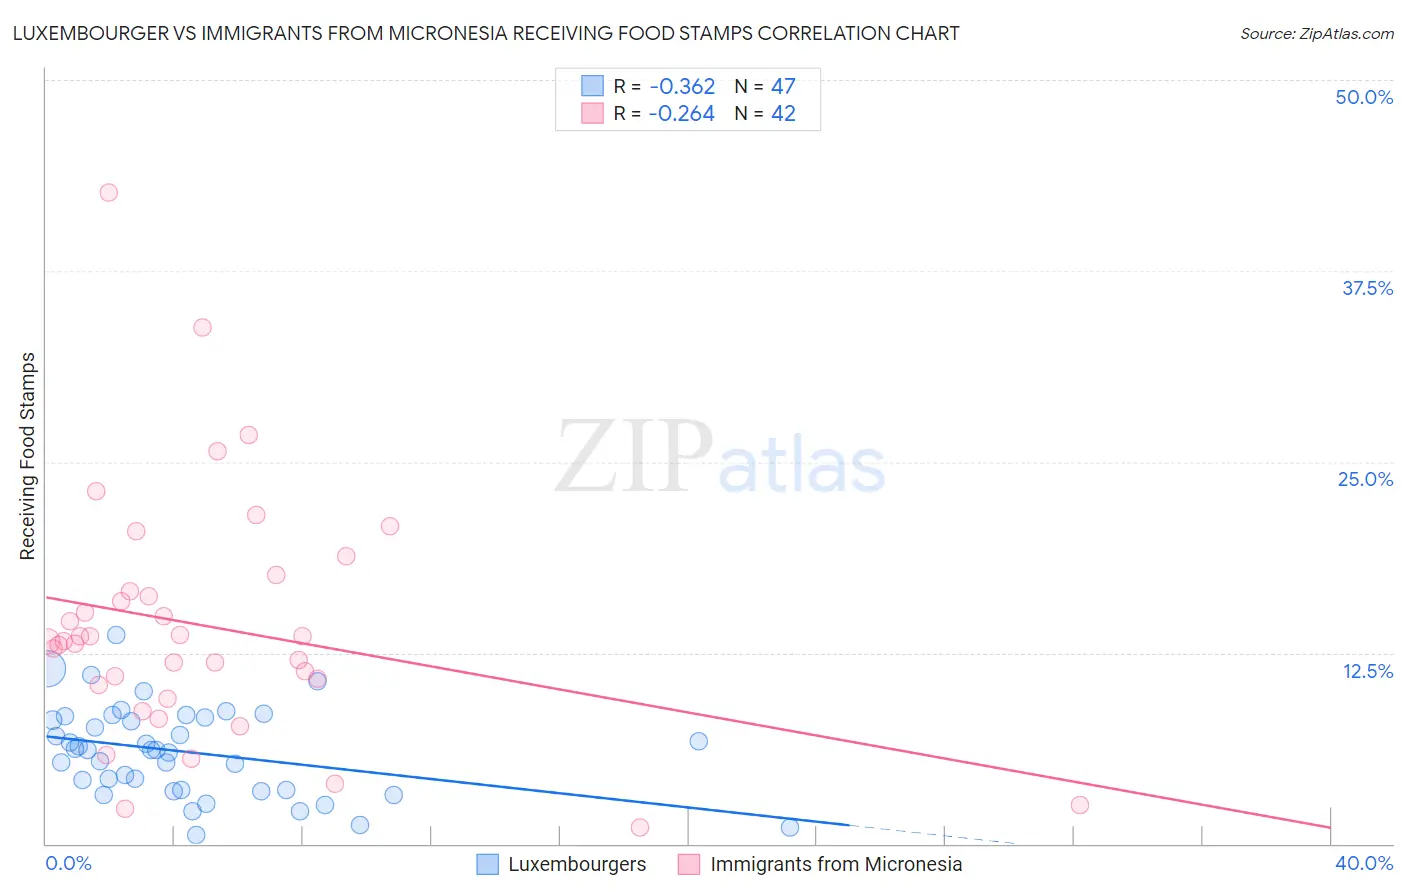
Luxembourger vs Immigrants from Micronesia Receiving Food Stamps Correlation Chart
The statistical analysis conducted on geographies consisting of 144,526,649 people shows a mild negative correlation between the proportion of Luxembourgers and percentage of population receiving government assistance and/or food stamps in the United States with a correlation coefficient (R) of -0.362 and weighted average of 9.1%. Similarly, the statistical analysis conducted on geographies consisting of 61,597,185 people shows a weak negative correlation between the proportion of Immigrants from Micronesia and percentage of population receiving government assistance and/or food stamps in the United States with a correlation coefficient (R) of -0.264 and weighted average of 13.5%, a difference of 47.9%.
Receiving Food Stamps Correlation Summary
| Measurement | Luxembourger | Immigrants from Micronesia |
| Minimum | 0.57% | 1.1% |
| Maximum | 13.6% | 42.6% |
| Range | 13.1% | 41.5% |
| Mean | 6.0% | 14.3% |
| Median | 6.2% | 13.3% |
| Interquartile 25% (IQ1) | 3.5% | 10.4% |
| Interquartile 75% (IQ3) | 8.2% | 16.5% |
| Interquartile Range (IQR) | 4.7% | 6.1% |
| Standard Deviation (Sample) | 2.9% | 8.0% |
| Standard Deviation (Population) | 2.9% | 7.9% |
Similar Demographics by Receiving Food Stamps
Demographics Similar to Luxembourgers by Receiving Food Stamps
In terms of receiving food stamps, the demographic groups most similar to Luxembourgers are Latvian (9.1%, a difference of 0.15%), Immigrants from Australia (9.2%, a difference of 0.25%), Eastern European (9.2%, a difference of 0.36%), Immigrants from Northern Europe (9.2%, a difference of 0.38%), and Immigrants from Hong Kong (9.1%, a difference of 0.48%).
| Demographics | Rating | Rank | Receiving Food Stamps |
| Maltese | 99.9 /100 | #14 | Exceptional 8.9% |
| Norwegians | 99.9 /100 | #15 | Exceptional 9.0% |
| Immigrants | Japan | 99.9 /100 | #16 | Exceptional 9.0% |
| Immigrants | Scotland | 99.9 /100 | #17 | Exceptional 9.0% |
| Danes | 99.9 /100 | #18 | Exceptional 9.0% |
| Immigrants | Hong Kong | 99.8 /100 | #19 | Exceptional 9.1% |
| Latvians | 99.8 /100 | #20 | Exceptional 9.1% |
| Luxembourgers | 99.8 /100 | #21 | Exceptional 9.1% |
| Immigrants | Australia | 99.8 /100 | #22 | Exceptional 9.2% |
| Eastern Europeans | 99.8 /100 | #23 | Exceptional 9.2% |
| Immigrants | Northern Europe | 99.8 /100 | #24 | Exceptional 9.2% |
| Immigrants | Ireland | 99.8 /100 | #25 | Exceptional 9.2% |
| Swedes | 99.8 /100 | #26 | Exceptional 9.2% |
| Bhutanese | 99.8 /100 | #27 | Exceptional 9.2% |
| Czechs | 99.8 /100 | #28 | Exceptional 9.2% |
Demographics Similar to Immigrants from Micronesia by Receiving Food Stamps
In terms of receiving food stamps, the demographic groups most similar to Immigrants from Micronesia are French American Indian (13.5%, a difference of 0.23%), Iroquois (13.5%, a difference of 0.30%), Immigrants from El Salvador (13.5%, a difference of 0.42%), Crow (13.4%, a difference of 0.65%), and Choctaw (13.6%, a difference of 0.73%).
| Demographics | Rating | Rank | Receiving Food Stamps |
| Salvadorans | 2.7 /100 | #232 | Tragic 13.2% |
| Cherokee | 2.5 /100 | #233 | Tragic 13.2% |
| Comanche | 2.4 /100 | #234 | Tragic 13.3% |
| Immigrants | Zaire | 1.9 /100 | #235 | Tragic 13.4% |
| Crow | 1.6 /100 | #236 | Tragic 13.4% |
| Immigrants | El Salvador | 1.5 /100 | #237 | Tragic 13.5% |
| French American Indians | 1.4 /100 | #238 | Tragic 13.5% |
| Immigrants | Micronesia | 1.3 /100 | #239 | Tragic 13.5% |
| Iroquois | 1.2 /100 | #240 | Tragic 13.5% |
| Choctaw | 1.0 /100 | #241 | Tragic 13.6% |
| Immigrants | Panama | 1.0 /100 | #242 | Tragic 13.6% |
| Somalis | 0.9 /100 | #243 | Tragic 13.7% |
| Cajuns | 0.9 /100 | #244 | Tragic 13.7% |
| Immigrants | Somalia | 0.9 /100 | #245 | Tragic 13.7% |
| Cree | 0.8 /100 | #246 | Tragic 13.7% |