Luxembourger vs Immigrants from Caribbean Receiving Food Stamps
COMPARE
Luxembourger
Immigrants from Caribbean
Receiving Food Stamps
Receiving Food Stamps Comparison
Luxembourgers
Immigrants from Caribbean
9.1%
RECEIVING FOOD STAMPS
99.8/ 100
METRIC RATING
21st/ 347
METRIC RANK
19.6%
RECEIVING FOOD STAMPS
0.0/ 100
METRIC RATING
331st/ 347
METRIC RANK
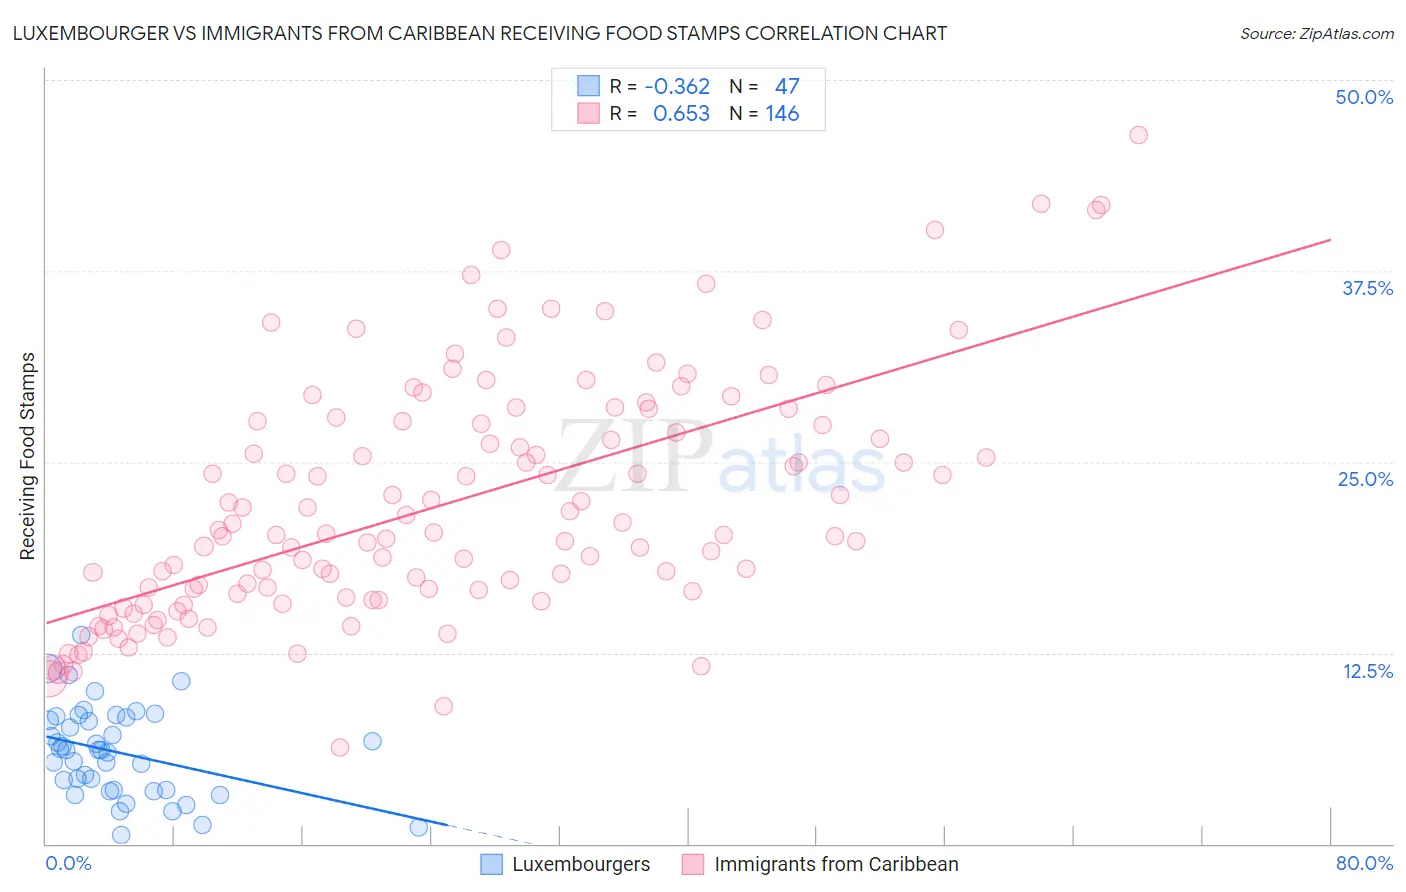
Luxembourger vs Immigrants from Caribbean Receiving Food Stamps Correlation Chart
The statistical analysis conducted on geographies consisting of 144,526,649 people shows a mild negative correlation between the proportion of Luxembourgers and percentage of population receiving government assistance and/or food stamps in the United States with a correlation coefficient (R) of -0.362 and weighted average of 9.1%. Similarly, the statistical analysis conducted on geographies consisting of 448,445,784 people shows a significant positive correlation between the proportion of Immigrants from Caribbean and percentage of population receiving government assistance and/or food stamps in the United States with a correlation coefficient (R) of 0.653 and weighted average of 19.6%, a difference of 114.7%.
Receiving Food Stamps Correlation Summary
| Measurement | Luxembourger | Immigrants from Caribbean |
| Minimum | 0.57% | 6.3% |
| Maximum | 13.6% | 46.4% |
| Range | 13.1% | 40.1% |
| Mean | 6.0% | 22.2% |
| Median | 6.2% | 20.3% |
| Interquartile 25% (IQ1) | 3.5% | 16.1% |
| Interquartile 75% (IQ3) | 8.2% | 27.7% |
| Interquartile Range (IQR) | 4.7% | 11.5% |
| Standard Deviation (Sample) | 2.9% | 7.8% |
| Standard Deviation (Population) | 2.9% | 7.8% |
Similar Demographics by Receiving Food Stamps
Demographics Similar to Luxembourgers by Receiving Food Stamps
In terms of receiving food stamps, the demographic groups most similar to Luxembourgers are Latvian (9.1%, a difference of 0.15%), Immigrants from Australia (9.2%, a difference of 0.25%), Eastern European (9.2%, a difference of 0.36%), Immigrants from Northern Europe (9.2%, a difference of 0.38%), and Immigrants from Hong Kong (9.1%, a difference of 0.48%).
| Demographics | Rating | Rank | Receiving Food Stamps |
| Maltese | 99.9 /100 | #14 | Exceptional 8.9% |
| Norwegians | 99.9 /100 | #15 | Exceptional 9.0% |
| Immigrants | Japan | 99.9 /100 | #16 | Exceptional 9.0% |
| Immigrants | Scotland | 99.9 /100 | #17 | Exceptional 9.0% |
| Danes | 99.9 /100 | #18 | Exceptional 9.0% |
| Immigrants | Hong Kong | 99.8 /100 | #19 | Exceptional 9.1% |
| Latvians | 99.8 /100 | #20 | Exceptional 9.1% |
| Luxembourgers | 99.8 /100 | #21 | Exceptional 9.1% |
| Immigrants | Australia | 99.8 /100 | #22 | Exceptional 9.2% |
| Eastern Europeans | 99.8 /100 | #23 | Exceptional 9.2% |
| Immigrants | Northern Europe | 99.8 /100 | #24 | Exceptional 9.2% |
| Immigrants | Ireland | 99.8 /100 | #25 | Exceptional 9.2% |
| Swedes | 99.8 /100 | #26 | Exceptional 9.2% |
| Bhutanese | 99.8 /100 | #27 | Exceptional 9.2% |
| Czechs | 99.8 /100 | #28 | Exceptional 9.2% |
Demographics Similar to Immigrants from Caribbean by Receiving Food Stamps
In terms of receiving food stamps, the demographic groups most similar to Immigrants from Caribbean are Pueblo (19.9%, a difference of 1.5%), Inupiat (20.1%, a difference of 2.2%), Yuman (20.2%, a difference of 3.1%), Pima (19.0%, a difference of 3.4%), and Immigrants from Cuba (20.8%, a difference of 6.2%).
| Demographics | Rating | Rank | Receiving Food Stamps |
| British West Indians | 0.0 /100 | #324 | Tragic 17.9% |
| Immigrants | Haiti | 0.0 /100 | #325 | Tragic 18.2% |
| Cubans | 0.0 /100 | #326 | Tragic 18.2% |
| Apache | 0.0 /100 | #327 | Tragic 18.3% |
| Colville | 0.0 /100 | #328 | Tragic 18.3% |
| Immigrants | Dominica | 0.0 /100 | #329 | Tragic 18.4% |
| Pima | 0.0 /100 | #330 | Tragic 19.0% |
| Immigrants | Caribbean | 0.0 /100 | #331 | Tragic 19.6% |
| Pueblo | 0.0 /100 | #332 | Tragic 19.9% |
| Inupiat | 0.0 /100 | #333 | Tragic 20.1% |
| Yuman | 0.0 /100 | #334 | Tragic 20.2% |
| Immigrants | Cuba | 0.0 /100 | #335 | Tragic 20.8% |
| Navajo | 0.0 /100 | #336 | Tragic 21.1% |
| Cape Verdeans | 0.0 /100 | #337 | Tragic 21.1% |
| Dominicans | 0.0 /100 | #338 | Tragic 21.4% |