Luxembourger vs Bangladeshi Receiving Food Stamps
COMPARE
Luxembourger
Bangladeshi
Receiving Food Stamps
Receiving Food Stamps Comparison
Luxembourgers
Bangladeshis
9.1%
RECEIVING FOOD STAMPS
99.8/ 100
METRIC RATING
21st/ 347
METRIC RANK
15.0%
RECEIVING FOOD STAMPS
0.0/ 100
METRIC RATING
283rd/ 347
METRIC RANK
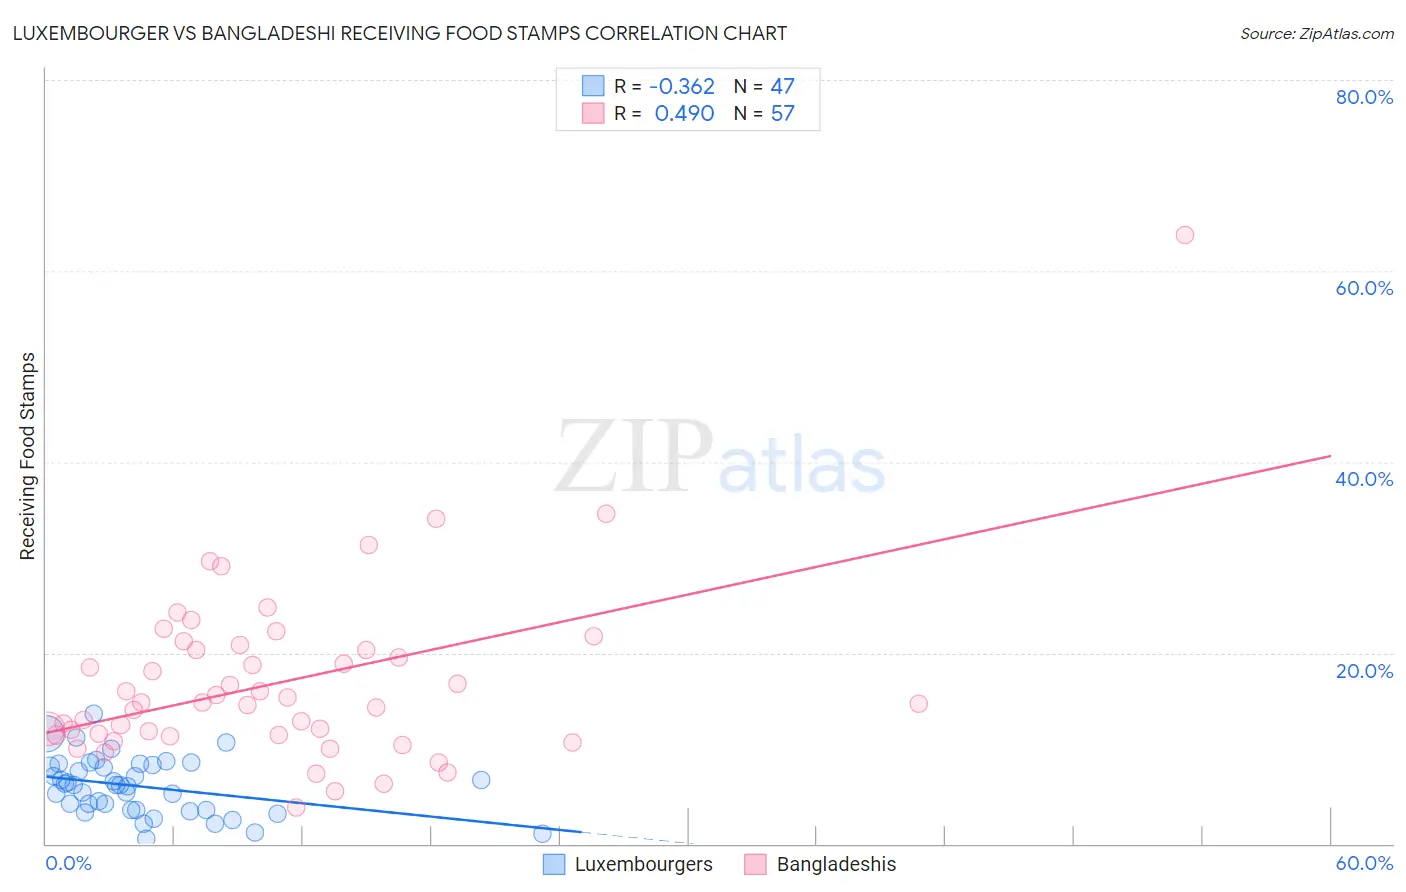
Luxembourger vs Bangladeshi Receiving Food Stamps Correlation Chart
The statistical analysis conducted on geographies consisting of 144,526,649 people shows a mild negative correlation between the proportion of Luxembourgers and percentage of population receiving government assistance and/or food stamps in the United States with a correlation coefficient (R) of -0.362 and weighted average of 9.1%. Similarly, the statistical analysis conducted on geographies consisting of 141,258,280 people shows a moderate positive correlation between the proportion of Bangladeshis and percentage of population receiving government assistance and/or food stamps in the United States with a correlation coefficient (R) of 0.490 and weighted average of 15.0%, a difference of 64.7%.
Receiving Food Stamps Correlation Summary
| Measurement | Luxembourger | Bangladeshi |
| Minimum | 0.57% | 3.8% |
| Maximum | 13.6% | 63.8% |
| Range | 13.1% | 60.0% |
| Mean | 6.0% | 16.9% |
| Median | 6.2% | 14.7% |
| Interquartile 25% (IQ1) | 3.5% | 11.4% |
| Interquartile 75% (IQ3) | 8.2% | 20.6% |
| Interquartile Range (IQR) | 4.7% | 9.2% |
| Standard Deviation (Sample) | 2.9% | 9.4% |
| Standard Deviation (Population) | 2.9% | 9.3% |
Similar Demographics by Receiving Food Stamps
Demographics Similar to Luxembourgers by Receiving Food Stamps
In terms of receiving food stamps, the demographic groups most similar to Luxembourgers are Latvian (9.1%, a difference of 0.15%), Immigrants from Australia (9.2%, a difference of 0.25%), Eastern European (9.2%, a difference of 0.36%), Immigrants from Northern Europe (9.2%, a difference of 0.38%), and Immigrants from Hong Kong (9.1%, a difference of 0.48%).
| Demographics | Rating | Rank | Receiving Food Stamps |
| Maltese | 99.9 /100 | #14 | Exceptional 8.9% |
| Norwegians | 99.9 /100 | #15 | Exceptional 9.0% |
| Immigrants | Japan | 99.9 /100 | #16 | Exceptional 9.0% |
| Immigrants | Scotland | 99.9 /100 | #17 | Exceptional 9.0% |
| Danes | 99.9 /100 | #18 | Exceptional 9.0% |
| Immigrants | Hong Kong | 99.8 /100 | #19 | Exceptional 9.1% |
| Latvians | 99.8 /100 | #20 | Exceptional 9.1% |
| Luxembourgers | 99.8 /100 | #21 | Exceptional 9.1% |
| Immigrants | Australia | 99.8 /100 | #22 | Exceptional 9.2% |
| Eastern Europeans | 99.8 /100 | #23 | Exceptional 9.2% |
| Immigrants | Northern Europe | 99.8 /100 | #24 | Exceptional 9.2% |
| Immigrants | Ireland | 99.8 /100 | #25 | Exceptional 9.2% |
| Swedes | 99.8 /100 | #26 | Exceptional 9.2% |
| Bhutanese | 99.8 /100 | #27 | Exceptional 9.2% |
| Czechs | 99.8 /100 | #28 | Exceptional 9.2% |
Demographics Similar to Bangladeshis by Receiving Food Stamps
In terms of receiving food stamps, the demographic groups most similar to Bangladeshis are Immigrants from Ecuador (15.0%, a difference of 0.010%), Immigrants from Central America (15.0%, a difference of 0.28%), Immigrants from Liberia (15.1%, a difference of 0.39%), African (15.1%, a difference of 0.53%), and Immigrants from Mexico (15.2%, a difference of 0.76%).
| Demographics | Rating | Rank | Receiving Food Stamps |
| Liberians | 0.1 /100 | #276 | Tragic 14.8% |
| Seminole | 0.1 /100 | #277 | Tragic 14.8% |
| Belizeans | 0.1 /100 | #278 | Tragic 14.8% |
| Kiowa | 0.0 /100 | #279 | Tragic 14.9% |
| Ecuadorians | 0.0 /100 | #280 | Tragic 14.9% |
| Spanish American Indians | 0.0 /100 | #281 | Tragic 14.9% |
| Immigrants | Central America | 0.0 /100 | #282 | Tragic 15.0% |
| Bangladeshis | 0.0 /100 | #283 | Tragic 15.0% |
| Immigrants | Ecuador | 0.0 /100 | #284 | Tragic 15.0% |
| Immigrants | Liberia | 0.0 /100 | #285 | Tragic 15.1% |
| Africans | 0.0 /100 | #286 | Tragic 15.1% |
| Immigrants | Mexico | 0.0 /100 | #287 | Tragic 15.2% |
| Immigrants | Belize | 0.0 /100 | #288 | Tragic 15.2% |
| Immigrants | Senegal | 0.0 /100 | #289 | Tragic 15.3% |
| Senegalese | 0.0 /100 | #290 | Tragic 15.4% |