Luxembourger vs Immigrants from Oceania 4 or more Vehicles in Household
COMPARE
Luxembourger
Immigrants from Oceania
4 or more Vehicles in Household
4 or more Vehicles in Household Comparison
Luxembourgers
Immigrants from Oceania
6.6%
4 OR MORE VEHICLES IN HOUSEHOLD
86.4/ 100
METRIC RATING
136th/ 347
METRIC RANK
7.6%
4 OR MORE VEHICLES IN HOUSEHOLD
100.0/ 100
METRIC RATING
55th/ 347
METRIC RANK
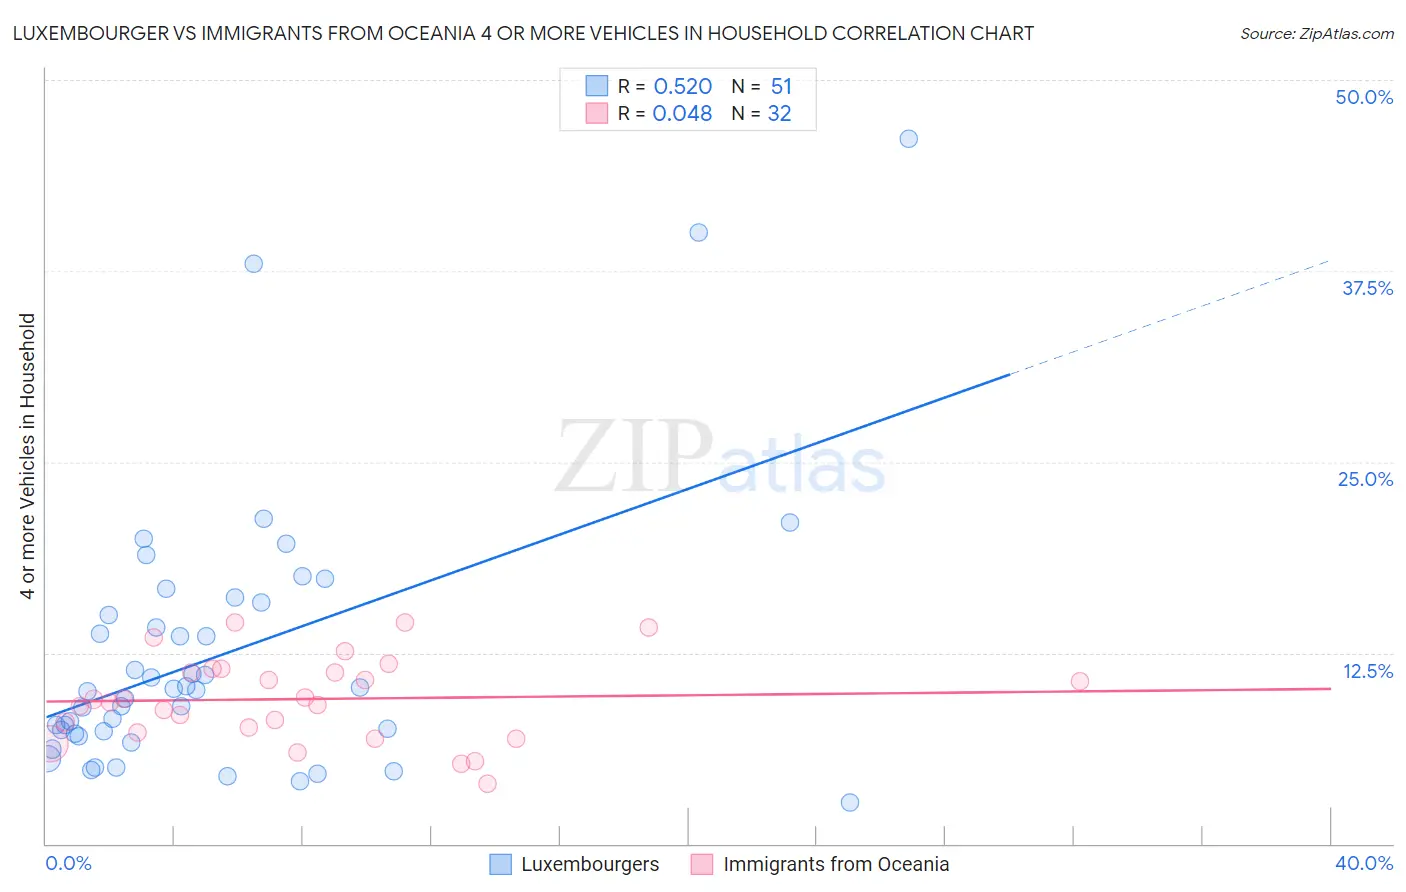
Luxembourger vs Immigrants from Oceania 4 or more Vehicles in Household Correlation Chart
The statistical analysis conducted on geographies consisting of 144,419,010 people shows a substantial positive correlation between the proportion of Luxembourgers and percentage of households with 4 or more vehicles available in the United States with a correlation coefficient (R) of 0.520 and weighted average of 6.6%. Similarly, the statistical analysis conducted on geographies consisting of 304,187,548 people shows no correlation between the proportion of Immigrants from Oceania and percentage of households with 4 or more vehicles available in the United States with a correlation coefficient (R) of 0.048 and weighted average of 7.6%, a difference of 15.2%.
4 or more Vehicles in Household Correlation Summary
| Measurement | Luxembourger | Immigrants from Oceania |
| Minimum | 2.7% | 3.9% |
| Maximum | 46.2% | 14.5% |
| Range | 43.5% | 10.6% |
| Mean | 12.4% | 9.5% |
| Median | 10.0% | 9.3% |
| Interquartile 25% (IQ1) | 7.2% | 7.5% |
| Interquartile 75% (IQ3) | 15.8% | 11.3% |
| Interquartile Range (IQR) | 8.6% | 3.9% |
| Standard Deviation (Sample) | 8.8% | 2.8% |
| Standard Deviation (Population) | 8.7% | 2.7% |
Similar Demographics by 4 or more Vehicles in Household
Demographics Similar to Luxembourgers by 4 or more Vehicles in Household
In terms of 4 or more vehicles in household, the demographic groups most similar to Luxembourgers are Tohono O'odham (6.6%, a difference of 0.070%), Ottawa (6.6%, a difference of 0.10%), Armenian (6.6%, a difference of 0.11%), French Canadian (6.6%, a difference of 0.21%), and Immigrants from Netherlands (6.6%, a difference of 0.31%).
| Demographics | Rating | Rank | 4 or more Vehicles in Household |
| Immigrants | England | 92.0 /100 | #129 | Exceptional 6.7% |
| Immigrants | Scotland | 89.0 /100 | #130 | Excellent 6.7% |
| Maltese | 88.4 /100 | #131 | Excellent 6.7% |
| Immigrants | Netherlands | 87.8 /100 | #132 | Excellent 6.6% |
| Armenians | 86.9 /100 | #133 | Excellent 6.6% |
| Ottawa | 86.9 /100 | #134 | Excellent 6.6% |
| Tohono O'odham | 86.7 /100 | #135 | Excellent 6.6% |
| Luxembourgers | 86.4 /100 | #136 | Excellent 6.6% |
| French Canadians | 85.4 /100 | #137 | Excellent 6.6% |
| Italians | 84.5 /100 | #138 | Excellent 6.6% |
| Jordanians | 82.1 /100 | #139 | Excellent 6.6% |
| Slavs | 81.6 /100 | #140 | Excellent 6.6% |
| Australians | 80.8 /100 | #141 | Excellent 6.6% |
| Immigrants | Iraq | 79.4 /100 | #142 | Good 6.5% |
| Immigrants | Canada | 78.6 /100 | #143 | Good 6.5% |
Demographics Similar to Immigrants from Oceania by 4 or more Vehicles in Household
In terms of 4 or more vehicles in household, the demographic groups most similar to Immigrants from Oceania are English (7.6%, a difference of 0.010%), Pennsylvania German (7.6%, a difference of 0.14%), Swedish (7.6%, a difference of 0.14%), Hispanic or Latino (7.6%, a difference of 0.17%), and Spaniard (7.6%, a difference of 0.24%).
| Demographics | Rating | Rank | 4 or more Vehicles in Household |
| Swiss | 100.0 /100 | #48 | Exceptional 7.8% |
| Cherokee | 100.0 /100 | #49 | Exceptional 7.7% |
| Immigrants | El Salvador | 100.0 /100 | #50 | Exceptional 7.7% |
| Immigrants | Laos | 100.0 /100 | #51 | Exceptional 7.7% |
| Japanese | 100.0 /100 | #52 | Exceptional 7.7% |
| Malaysians | 100.0 /100 | #53 | Exceptional 7.7% |
| Dutch | 100.0 /100 | #54 | Exceptional 7.7% |
| Immigrants | Oceania | 100.0 /100 | #55 | Exceptional 7.6% |
| English | 100.0 /100 | #56 | Exceptional 7.6% |
| Pennsylvania Germans | 100.0 /100 | #57 | Exceptional 7.6% |
| Swedes | 100.0 /100 | #58 | Exceptional 7.6% |
| Hispanics or Latinos | 100.0 /100 | #59 | Exceptional 7.6% |
| Spaniards | 100.0 /100 | #60 | Exceptional 7.6% |
| Europeans | 100.0 /100 | #61 | Exceptional 7.6% |
| Chippewa | 100.0 /100 | #62 | Exceptional 7.6% |