Luxembourger vs Immigrants from Oceania In Labor Force | Age 20-64
COMPARE
Luxembourger
Immigrants from Oceania
In Labor Force | Age 20-64
In Labor Force | Age 20-64 Comparison
Luxembourgers
Immigrants from Oceania
81.9%
IN LABOR FORCE | AGE 20-64
100.0/ 100
METRIC RATING
4th/ 347
METRIC RANK
79.3%
IN LABOR FORCE | AGE 20-64
19.1/ 100
METRIC RATING
200th/ 347
METRIC RANK
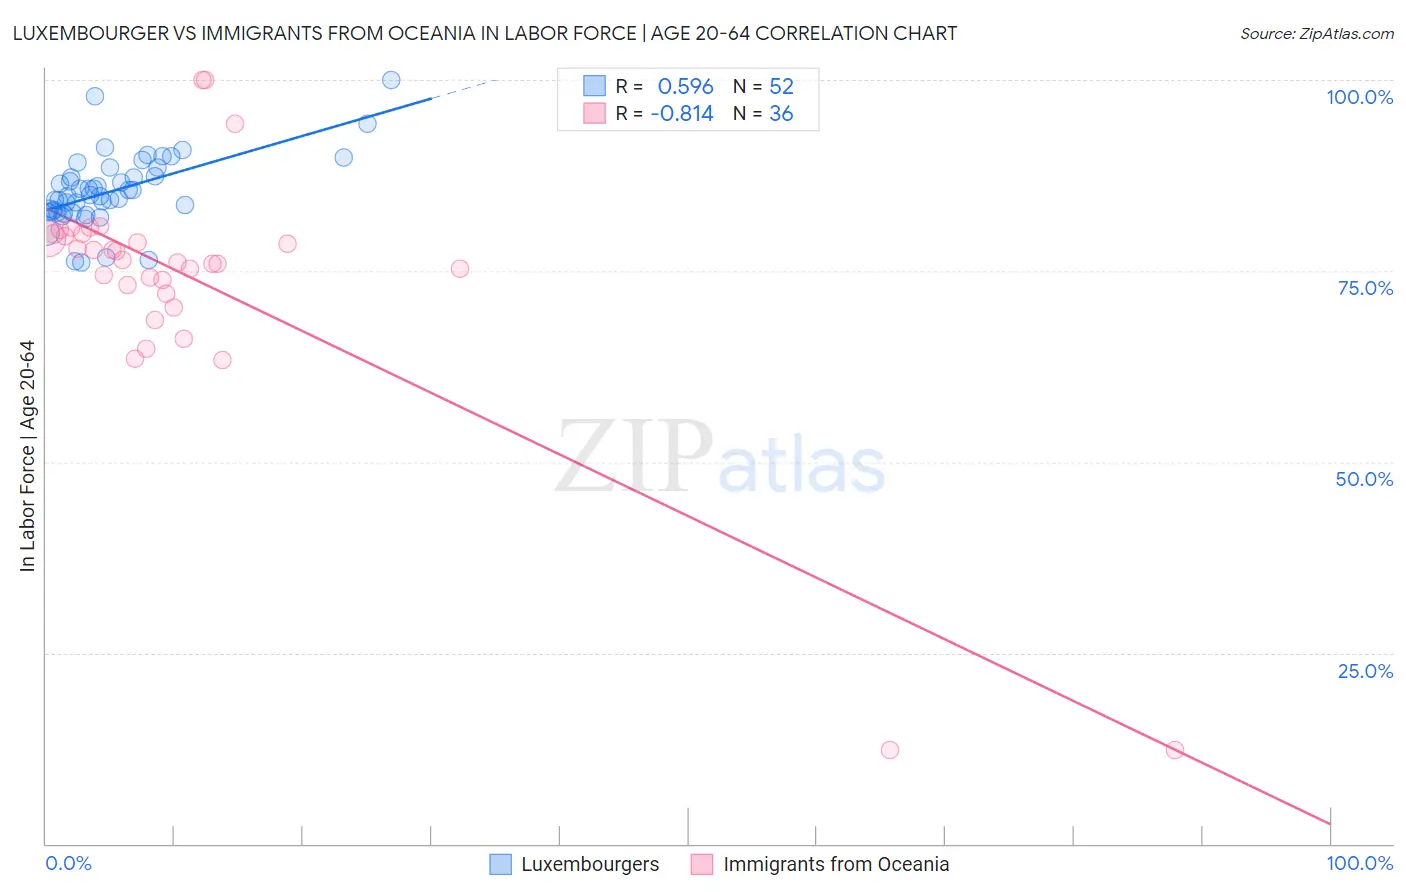
Luxembourger vs Immigrants from Oceania In Labor Force | Age 20-64 Correlation Chart
The statistical analysis conducted on geographies consisting of 144,682,920 people shows a substantial positive correlation between the proportion of Luxembourgers and labor force participation rate among population between the ages 20 and 64 in the United States with a correlation coefficient (R) of 0.596 and weighted average of 81.9%. Similarly, the statistical analysis conducted on geographies consisting of 305,520,725 people shows a very strong negative correlation between the proportion of Immigrants from Oceania and labor force participation rate among population between the ages 20 and 64 in the United States with a correlation coefficient (R) of -0.814 and weighted average of 79.3%, a difference of 3.2%.
In Labor Force | Age 20-64 Correlation Summary
| Measurement | Luxembourger | Immigrants from Oceania |
| Minimum | 76.2% | 12.2% |
| Maximum | 100.0% | 100.0% |
| Range | 23.8% | 87.8% |
| Mean | 85.5% | 73.5% |
| Median | 84.9% | 76.3% |
| Interquartile 25% (IQ1) | 82.7% | 72.6% |
| Interquartile 75% (IQ3) | 88.0% | 79.7% |
| Interquartile Range (IQR) | 5.3% | 7.1% |
| Standard Deviation (Sample) | 4.7% | 17.1% |
| Standard Deviation (Population) | 4.6% | 16.9% |
Similar Demographics by In Labor Force | Age 20-64
Demographics Similar to Luxembourgers by In Labor Force | Age 20-64
In terms of in labor force | age 20-64, the demographic groups most similar to Luxembourgers are Immigrants from Bolivia (81.9%, a difference of 0.12%), Ethiopian (82.0%, a difference of 0.13%), Bolivian (81.7%, a difference of 0.20%), Immigrants from Ethiopia (82.1%, a difference of 0.25%), and Somali (81.6%, a difference of 0.31%).
| Demographics | Rating | Rank | In Labor Force | Age 20-64 |
| Immigrants | Ethiopia | 100.0 /100 | #1 | Exceptional 82.1% |
| Ethiopians | 100.0 /100 | #2 | Exceptional 82.0% |
| Immigrants | Bolivia | 100.0 /100 | #3 | Exceptional 81.9% |
| Luxembourgers | 100.0 /100 | #4 | Exceptional 81.9% |
| Bolivians | 100.0 /100 | #5 | Exceptional 81.7% |
| Somalis | 100.0 /100 | #6 | Exceptional 81.6% |
| Immigrants | Cameroon | 100.0 /100 | #7 | Exceptional 81.6% |
| Immigrants | Somalia | 100.0 /100 | #8 | Exceptional 81.6% |
| Sierra Leoneans | 100.0 /100 | #9 | Exceptional 81.5% |
| Immigrants | Sierra Leone | 100.0 /100 | #10 | Exceptional 81.5% |
| Immigrants | Eastern Africa | 100.0 /100 | #11 | Exceptional 81.3% |
| Immigrants | Eritrea | 100.0 /100 | #12 | Exceptional 81.3% |
| Immigrants | India | 100.0 /100 | #13 | Exceptional 81.3% |
| Cambodians | 100.0 /100 | #14 | Exceptional 81.1% |
| Bulgarians | 100.0 /100 | #15 | Exceptional 81.1% |
Demographics Similar to Immigrants from Oceania by In Labor Force | Age 20-64
In terms of in labor force | age 20-64, the demographic groups most similar to Immigrants from Oceania are Immigrants from Nicaragua (79.3%, a difference of 0.0%), Dutch (79.3%, a difference of 0.010%), Nicaraguan (79.3%, a difference of 0.010%), Iraqi (79.3%, a difference of 0.020%), and Immigrants from Cambodia (79.3%, a difference of 0.020%).
| Demographics | Rating | Rank | In Labor Force | Age 20-64 |
| Indonesians | 26.1 /100 | #193 | Fair 79.4% |
| Immigrants | Thailand | 24.8 /100 | #194 | Fair 79.4% |
| Immigrants | Austria | 23.7 /100 | #195 | Fair 79.4% |
| Ecuadorians | 23.1 /100 | #196 | Fair 79.4% |
| Immigrants | Senegal | 22.5 /100 | #197 | Fair 79.4% |
| Immigrants | Laos | 21.5 /100 | #198 | Fair 79.4% |
| Dutch | 20.2 /100 | #199 | Fair 79.3% |
| Immigrants | Oceania | 19.1 /100 | #200 | Poor 79.3% |
| Immigrants | Nicaragua | 19.0 /100 | #201 | Poor 79.3% |
| Nicaraguans | 18.3 /100 | #202 | Poor 79.3% |
| Iraqis | 17.7 /100 | #203 | Poor 79.3% |
| Immigrants | Cambodia | 17.6 /100 | #204 | Poor 79.3% |
| Immigrants | Congo | 17.5 /100 | #205 | Poor 79.3% |
| Immigrants | Ecuador | 16.9 /100 | #206 | Poor 79.3% |
| Sub-Saharan Africans | 16.5 /100 | #207 | Poor 79.3% |