Lebanese vs Puerto Rican Disability Age 18 to 34
COMPARE
Lebanese
Puerto Rican
Disability Age 18 to 34
Disability Age 18 to 34 Comparison
Lebanese
Puerto Ricans
6.8%
DISABILITY AGE 18 TO 34
13.3/ 100
METRIC RATING
205th/ 347
METRIC RANK
8.0%
DISABILITY AGE 18 TO 34
0.0/ 100
METRIC RATING
316th/ 347
METRIC RANK
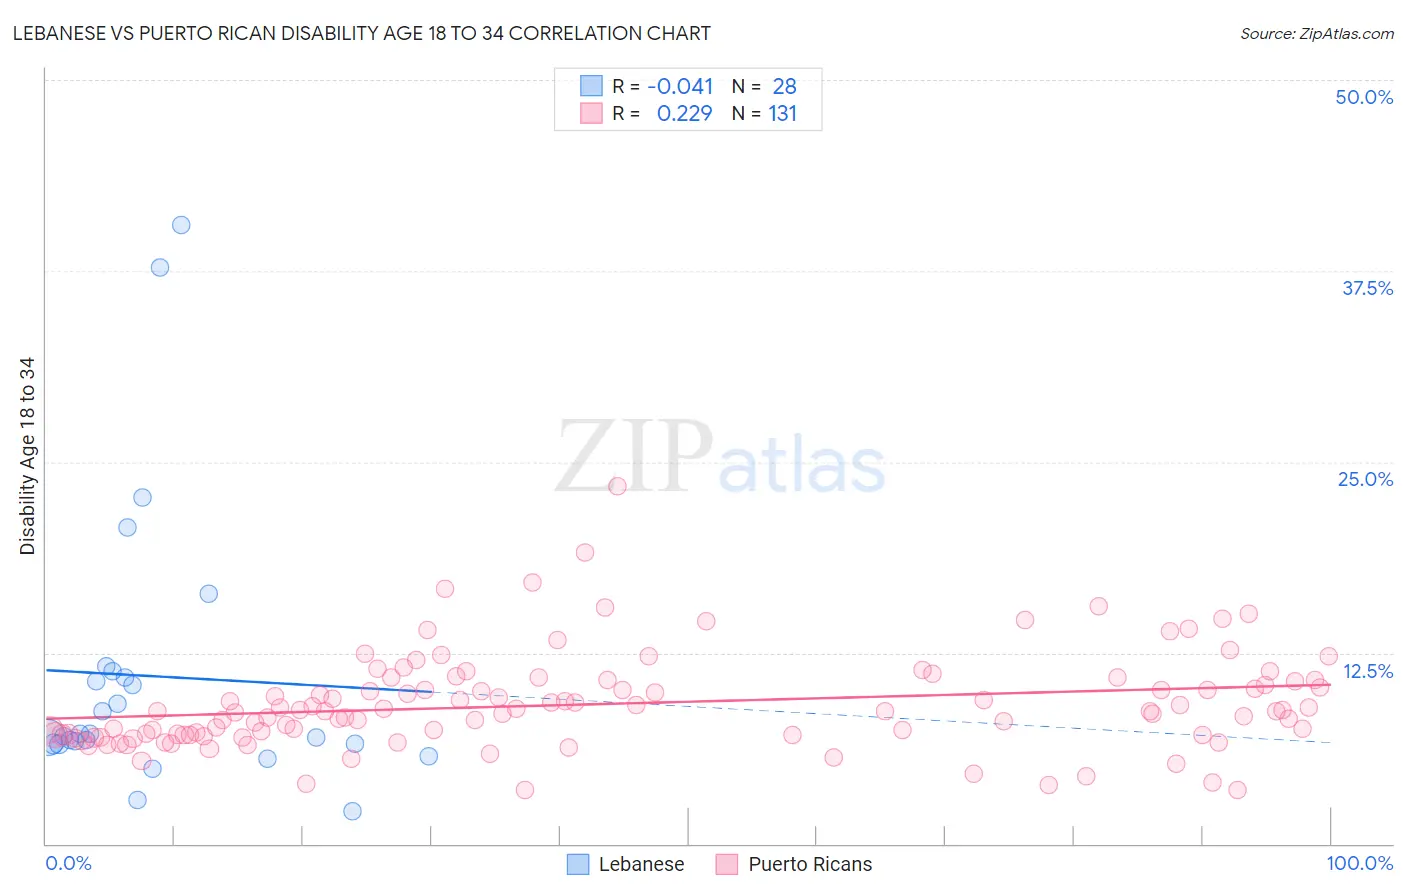
Lebanese vs Puerto Rican Disability Age 18 to 34 Correlation Chart
The statistical analysis conducted on geographies consisting of 400,691,364 people shows no correlation between the proportion of Lebanese and percentage of population with a disability between the ages 18 and 35 in the United States with a correlation coefficient (R) of -0.041 and weighted average of 6.8%. Similarly, the statistical analysis conducted on geographies consisting of 525,628,404 people shows a weak positive correlation between the proportion of Puerto Ricans and percentage of population with a disability between the ages 18 and 35 in the United States with a correlation coefficient (R) of 0.229 and weighted average of 8.0%, a difference of 17.6%.
Disability Age 18 to 34 Correlation Summary
| Measurement | Lebanese | Puerto Rican |
| Minimum | 2.1% | 3.5% |
| Maximum | 40.5% | 23.4% |
| Range | 38.4% | 19.9% |
| Mean | 11.0% | 9.1% |
| Median | 7.1% | 8.7% |
| Interquartile 25% (IQ1) | 6.6% | 7.1% |
| Interquartile 75% (IQ3) | 11.1% | 10.6% |
| Interquartile Range (IQR) | 4.5% | 3.5% |
| Standard Deviation (Sample) | 9.2% | 3.1% |
| Standard Deviation (Population) | 9.0% | 3.1% |
Similar Demographics by Disability Age 18 to 34
Demographics Similar to Lebanese by Disability Age 18 to 34
In terms of disability age 18 to 34, the demographic groups most similar to Lebanese are Immigrants from Bosnia and Herzegovina (6.8%, a difference of 0.050%), Hispanic or Latino (6.8%, a difference of 0.080%), Japanese (6.8%, a difference of 0.080%), Mexican (6.8%, a difference of 0.11%), and Immigrants from Scotland (6.8%, a difference of 0.13%).
| Demographics | Rating | Rank | Disability Age 18 to 34 |
| Australians | 19.4 /100 | #198 | Poor 6.8% |
| Kenyans | 18.3 /100 | #199 | Poor 6.8% |
| Sierra Leoneans | 17.5 /100 | #200 | Poor 6.8% |
| Greeks | 16.1 /100 | #201 | Poor 6.8% |
| Panamanians | 15.8 /100 | #202 | Poor 6.8% |
| Hispanics or Latinos | 13.8 /100 | #203 | Poor 6.8% |
| Immigrants | Bosnia and Herzegovina | 13.6 /100 | #204 | Poor 6.8% |
| Lebanese | 13.3 /100 | #205 | Poor 6.8% |
| Japanese | 12.8 /100 | #206 | Poor 6.8% |
| Mexicans | 12.6 /100 | #207 | Poor 6.8% |
| Immigrants | Scotland | 12.4 /100 | #208 | Poor 6.8% |
| Immigrants | Burma/Myanmar | 12.3 /100 | #209 | Poor 6.8% |
| Latvians | 11.1 /100 | #210 | Poor 6.8% |
| Immigrants | Norway | 10.0 /100 | #211 | Tragic 6.8% |
| Luxembourgers | 9.4 /100 | #212 | Tragic 6.9% |
Demographics Similar to Puerto Ricans by Disability Age 18 to 34
In terms of disability age 18 to 34, the demographic groups most similar to Puerto Ricans are American (8.0%, a difference of 0.26%), Hmong (8.1%, a difference of 0.46%), French Canadian (8.1%, a difference of 0.88%), Aleut (8.1%, a difference of 0.93%), and Navajo (8.1%, a difference of 0.97%).
| Demographics | Rating | Rank | Disability Age 18 to 34 |
| Alaska Natives | 0.0 /100 | #309 | Tragic 7.8% |
| Finns | 0.0 /100 | #310 | Tragic 7.8% |
| French | 0.0 /100 | #311 | Tragic 7.9% |
| Spanish Americans | 0.0 /100 | #312 | Tragic 7.9% |
| Iroquois | 0.0 /100 | #313 | Tragic 7.9% |
| Colville | 0.0 /100 | #314 | Tragic 7.9% |
| Americans | 0.0 /100 | #315 | Tragic 8.0% |
| Puerto Ricans | 0.0 /100 | #316 | Tragic 8.0% |
| Hmong | 0.0 /100 | #317 | Tragic 8.1% |
| French Canadians | 0.0 /100 | #318 | Tragic 8.1% |
| Aleuts | 0.0 /100 | #319 | Tragic 8.1% |
| Navajo | 0.0 /100 | #320 | Tragic 8.1% |
| Blackfeet | 0.0 /100 | #321 | Tragic 8.1% |
| Cree | 0.0 /100 | #322 | Tragic 8.1% |
| French American Indians | 0.0 /100 | #323 | Tragic 8.2% |