Lebanese vs Norwegian Female Poverty
COMPARE
Lebanese
Norwegian
Female Poverty
Female Poverty Comparison
Lebanese
Norwegians
13.4%
FEMALE POVERTY
55.9/ 100
METRIC RATING
169th/ 347
METRIC RANK
11.5%
FEMALE POVERTY
99.8/ 100
METRIC RATING
19th/ 347
METRIC RANK
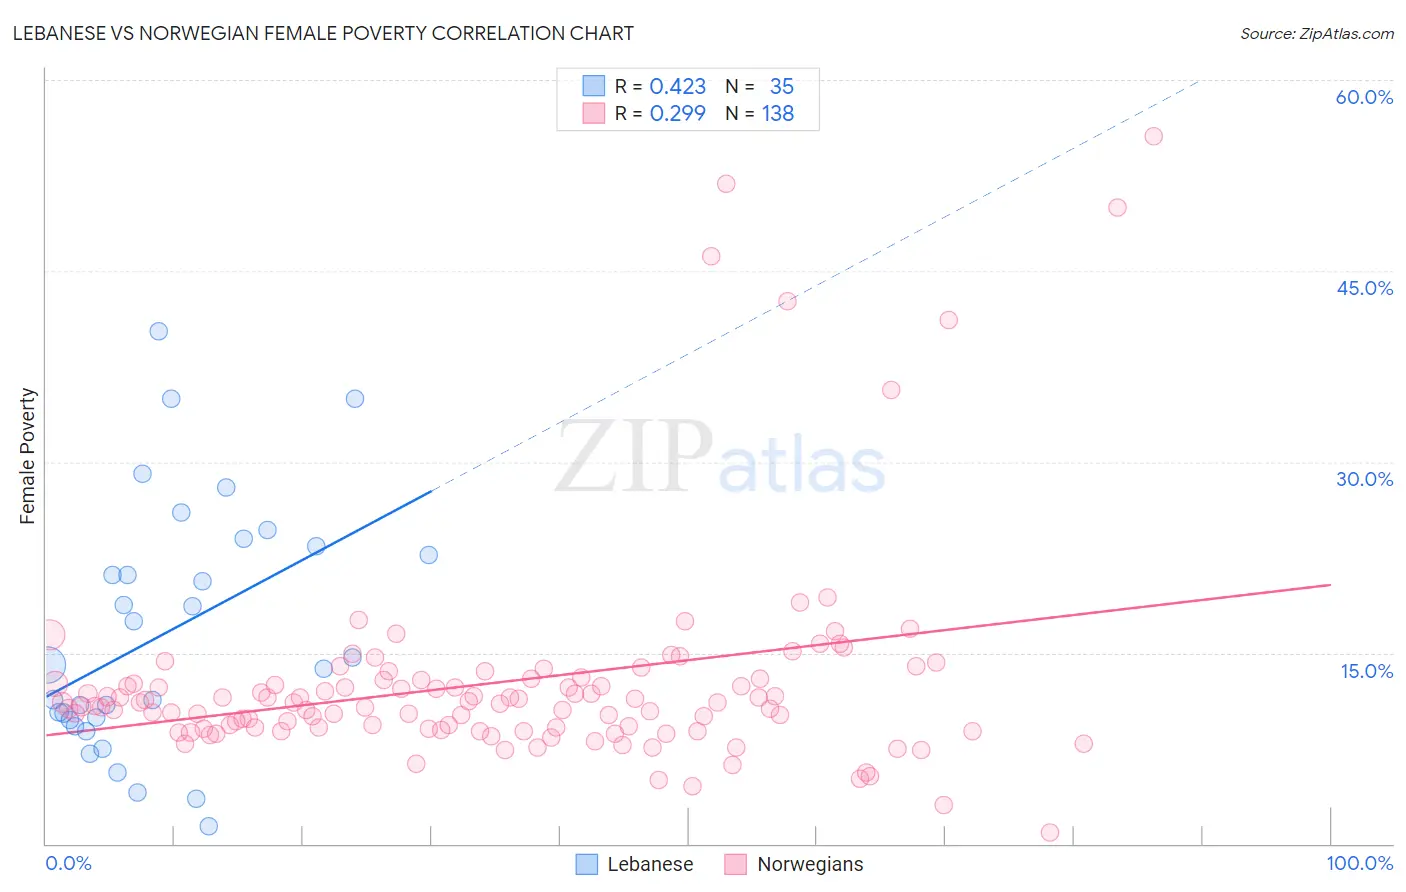
Lebanese vs Norwegian Female Poverty Correlation Chart
The statistical analysis conducted on geographies consisting of 401,241,772 people shows a moderate positive correlation between the proportion of Lebanese and poverty level among females in the United States with a correlation coefficient (R) of 0.423 and weighted average of 13.4%. Similarly, the statistical analysis conducted on geographies consisting of 532,481,223 people shows a weak positive correlation between the proportion of Norwegians and poverty level among females in the United States with a correlation coefficient (R) of 0.299 and weighted average of 11.5%, a difference of 16.2%.
Female Poverty Correlation Summary
| Measurement | Lebanese | Norwegian |
| Minimum | 1.3% | 0.92% |
| Maximum | 40.3% | 55.6% |
| Range | 38.9% | 54.6% |
| Mean | 16.6% | 12.7% |
| Median | 14.0% | 11.1% |
| Interquartile 25% (IQ1) | 9.8% | 9.0% |
| Interquartile 75% (IQ3) | 23.4% | 12.9% |
| Interquartile Range (IQR) | 13.6% | 3.8% |
| Standard Deviation (Sample) | 9.6% | 8.4% |
| Standard Deviation (Population) | 9.5% | 8.4% |
Similar Demographics by Female Poverty
Demographics Similar to Lebanese by Female Poverty
In terms of female poverty, the demographic groups most similar to Lebanese are Colombian (13.4%, a difference of 0.020%), Aleut (13.4%, a difference of 0.080%), White/Caucasian (13.4%, a difference of 0.13%), Immigrants from Chile (13.3%, a difference of 0.14%), and Mongolian (13.4%, a difference of 0.23%).
| Demographics | Rating | Rank | Female Poverty |
| Guamanians/Chamorros | 62.4 /100 | #162 | Good 13.3% |
| Immigrants | Albania | 62.4 /100 | #163 | Good 13.3% |
| Ethiopians | 62.3 /100 | #164 | Good 13.3% |
| Scotch-Irish | 62.1 /100 | #165 | Good 13.3% |
| Immigrants | Oceania | 59.7 /100 | #166 | Average 13.3% |
| Immigrants | Chile | 57.4 /100 | #167 | Average 13.3% |
| Aleuts | 56.7 /100 | #168 | Average 13.4% |
| Lebanese | 55.9 /100 | #169 | Average 13.4% |
| Colombians | 55.7 /100 | #170 | Average 13.4% |
| Whites/Caucasians | 54.6 /100 | #171 | Average 13.4% |
| Mongolians | 53.6 /100 | #172 | Average 13.4% |
| Immigrants | Afghanistan | 50.8 /100 | #173 | Average 13.4% |
| Immigrants | Iraq | 50.0 /100 | #174 | Average 13.4% |
| Celtics | 49.9 /100 | #175 | Average 13.4% |
| Immigrants | Spain | 49.9 /100 | #176 | Average 13.4% |
Demographics Similar to Norwegians by Female Poverty
In terms of female poverty, the demographic groups most similar to Norwegians are Immigrants from Scotland (11.5%, a difference of 0.040%), Bolivian (11.5%, a difference of 0.090%), Immigrants from Bolivia (11.5%, a difference of 0.16%), Eastern European (11.5%, a difference of 0.23%), and Latvian (11.4%, a difference of 0.64%).
| Demographics | Rating | Rank | Female Poverty |
| Bhutanese | 99.9 /100 | #12 | Exceptional 11.3% |
| Immigrants | Lithuania | 99.9 /100 | #13 | Exceptional 11.3% |
| Lithuanians | 99.8 /100 | #14 | Exceptional 11.4% |
| Latvians | 99.8 /100 | #15 | Exceptional 11.4% |
| Immigrants | Bolivia | 99.8 /100 | #16 | Exceptional 11.5% |
| Bolivians | 99.8 /100 | #17 | Exceptional 11.5% |
| Immigrants | Scotland | 99.8 /100 | #18 | Exceptional 11.5% |
| Norwegians | 99.8 /100 | #19 | Exceptional 11.5% |
| Eastern Europeans | 99.7 /100 | #20 | Exceptional 11.5% |
| Italians | 99.7 /100 | #21 | Exceptional 11.6% |
| Swedes | 99.7 /100 | #22 | Exceptional 11.6% |
| Burmese | 99.7 /100 | #23 | Exceptional 11.6% |
| Luxembourgers | 99.7 /100 | #24 | Exceptional 11.6% |
| Immigrants | Northern Europe | 99.6 /100 | #25 | Exceptional 11.6% |
| Croatians | 99.6 /100 | #26 | Exceptional 11.6% |